Quarterly Business Trends Report: July to September 2026
LOGO.com's Q3 2026 report analyzes 50,126 new logos and millions of related data points to reveal how and where new businesses are being built, what their brands look like, and which products and domains founders choose first.
Every quarter, hundreds of thousands of people sit down to start a business and many of them begin by creating a brand. Between July 1 and September 30, 2026, LOGO.com saw 50,126 logos created. Alongside those logos, founders on the platform generated 171,100 unique custom icons, 141,455 palette selections, 69,213 font attributions on finished logos, and 417,271 business stage selections during the same window.
This is the fourth installment of our quarterly business trends series, and the shifts this quarter are among the sharpest we have recorded. Technology retook the top declared industry from Fashion. Brush returned to the top of the custom icon style ranking after one quarter away, and the style menu itself grew back from eight options to twelve. Publishing a one page website became the single most common step after the logo, ahead of claiming a domain for the first time in the series. And .online went from leading a three way race to taking more than two thirds of all domain selections on its own.
This report is built for founders, agencies, journalists, and educators who need a current view of how new businesses are being built. According to LOGO.com data, here is what Q3 2026 looked like, and how it compared to Q2 2026.
The Q3 2026 New Business Profile
Compiled from the most common values across Q3 2026 brands, the typical new founder on LOGO.com this quarter looks like this:
- Self description: Business owner (84.6 percent of qualified founders, excluding students and personal use)
- Business stage: Idea phase, narrowly ahead of those actively starting a business (41.3 percent idea versus 39.9 percent starting)
- Industry: Technology, Fashion, or Education
- Brand colors: White paired with black, with green or blue as the accent hue
- Custom icon style: Brush, Solid, or Ink
- Top product wanted: A website, followed by brand guidelines and social media content
- Most typed slogan word: Every (1,022 occurrences across slogans on created logos)
- Most typed business name word: Solutions (91 occurrences across logos created)
- What they build next: A one page website, then a custom domain, then a brand kit
Compared to the Q2 2026 composite, the dominant founder still looks like a brand new business owner at the idea stage who wants a website first. What changed is the order of the steps around that founder. Technology edged past Fashion as the most declared industry. Brush replaced Solid as the most generated custom icon style. And the one page website overtook the custom domain as the most common thing founders build right after their logo. Future quarterly reports will track how this composite continues to shift.
Who Is Starting a Business
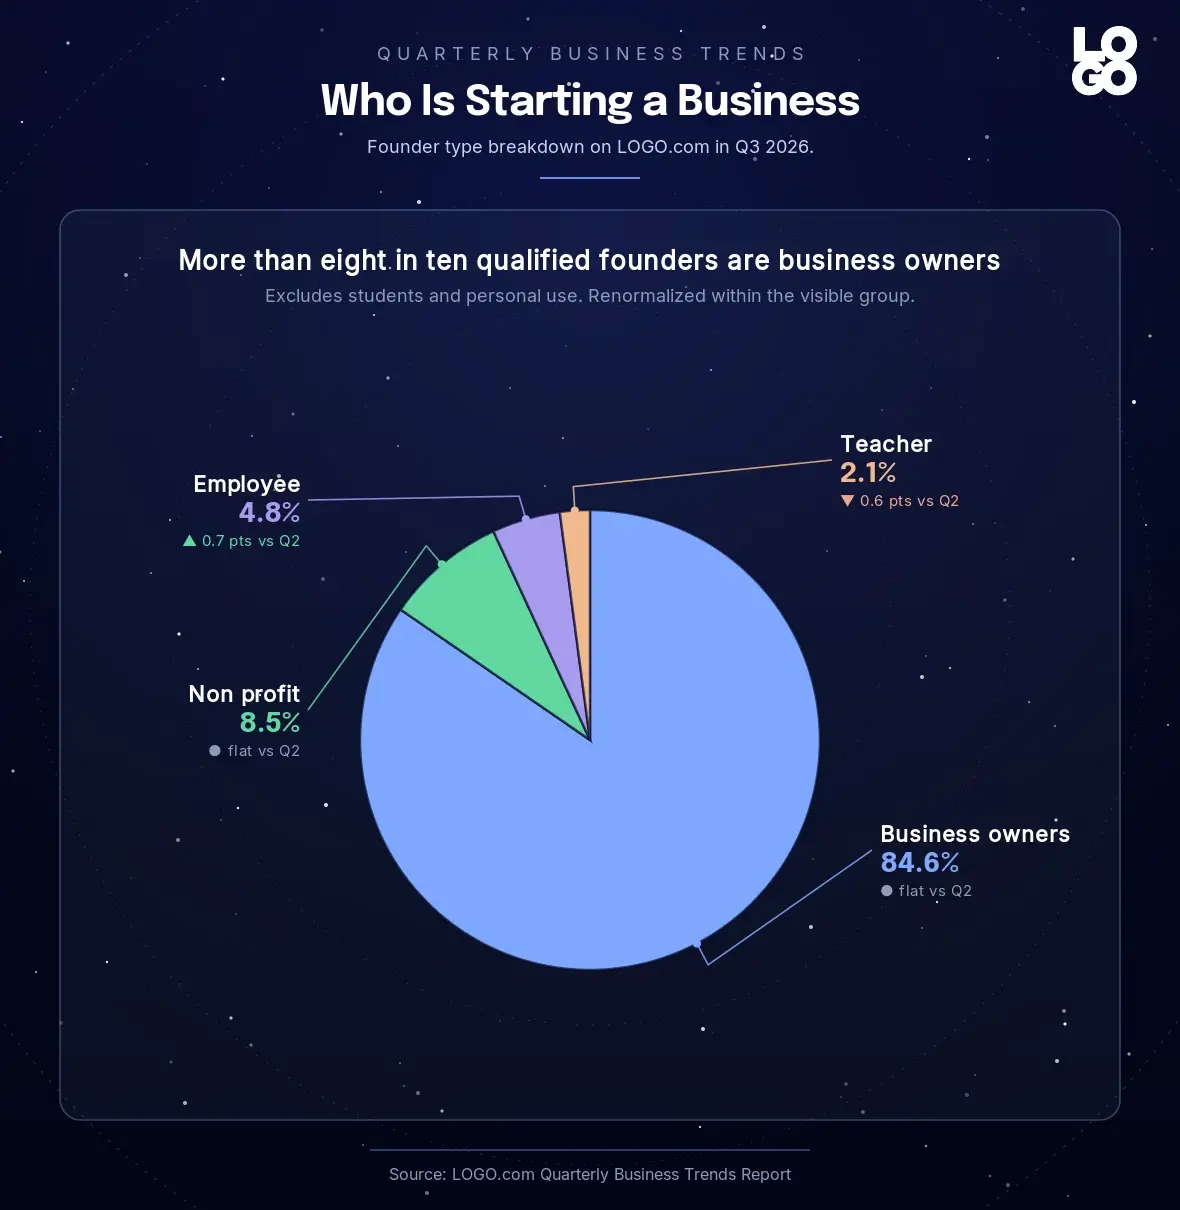
When new LOGO.com users describe themselves at sign up, the large majority self identify as business owners. According to LOGO.com data, business owners account for 84.6 percent of the qualified founder pool in Q3 2026 (15,006 self descriptions after excluding students, personal use, and blank responses), with the rest split across non profit founders (8.5 percent), employees launching side projects (4.8 percent), and teachers building school or community businesses (2.1 percent).
The Q2 2026 mix, measured the same way across a qualified pool of 40,018 self descriptions, was 84.6 percent business owners, 8.5 percent non profit founders, 4.1 percent employees, and 2.7 percent teachers. Quarter over quarter, business owners and non profits held exactly flat to one decimal place, employees gained 0.7 points, and teachers gave back 0.6 points.
The reading: the composition of the founder pool is now stable to a degree that is itself the finding. Three straight quarters of business owners holding above four in five, and non profits holding close to one in ten, means these shares are structural rather than seasonal. The small swap between employees and teachers is the only movement, and it fits the calendar. Teachers build in the spring and early summer, while employees launching side projects pick up through the late summer months.
A note on measurement. From this quarter the founder type is read from the business stage selection step for both quarters, because the separate brand creation event stopped emitting during June and July. The Q2 figures above are recomputed on that same basis so the two quarters line up exactly.
What Stage Founders Are At
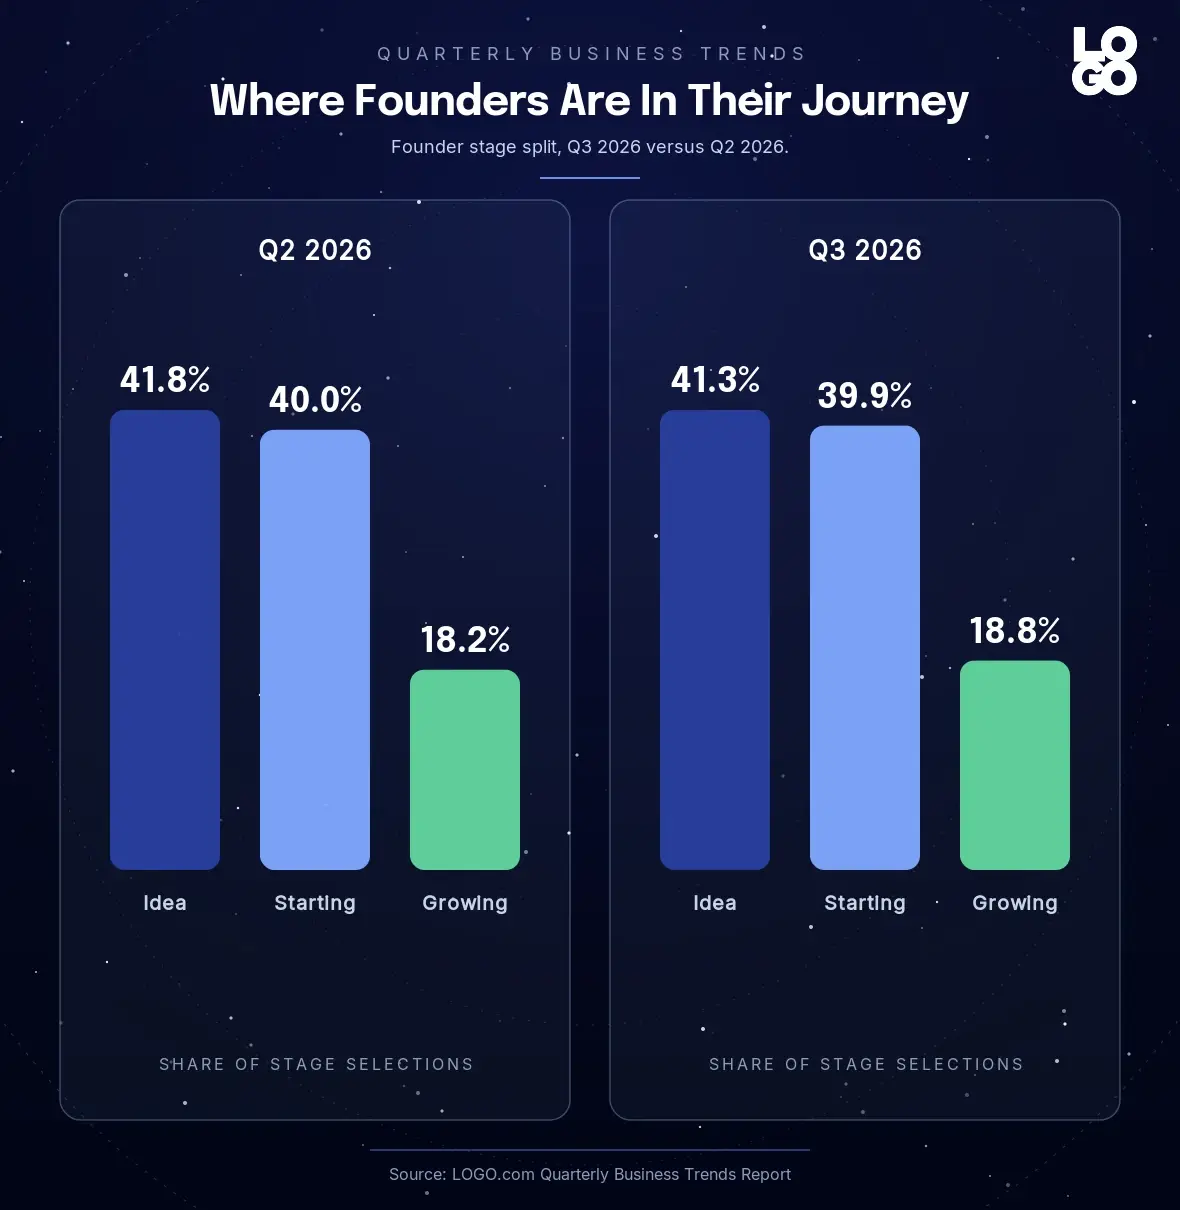
According to LOGO.com data, the business stage breakdown across 417,271 stage selections in Q3 2026 keeps the same two way race at the top. Founders with just an idea make up 41.3 percent of stage selections, founders actively starting a business make up 39.9 percent, and founders growing an existing business make up 18.8 percent.
Q2 2026 looked nearly identical. Across 727,993 stage selections last quarter, Idea was 41.8 percent, Starting was 40.0 percent, and Growing was 18.2 percent. Idea stage eased back 0.5 points, Starting held flat, and Growing gained 0.6 points, which makes Q3 the first quarter in the series where founders with an existing business added share rather than giving it up.
The takeaway for product teams has not changed. More than four in five founders on LOGO.com are at the idea or starting stage, and the post logo data later in this report shows exactly what they do with that energy: they publish. The small lift in Growing stage founders is worth watching into Q4, because established businesses refreshing a brand before the holiday season would be a natural seasonal driver.
Most Popular Industries in 2026
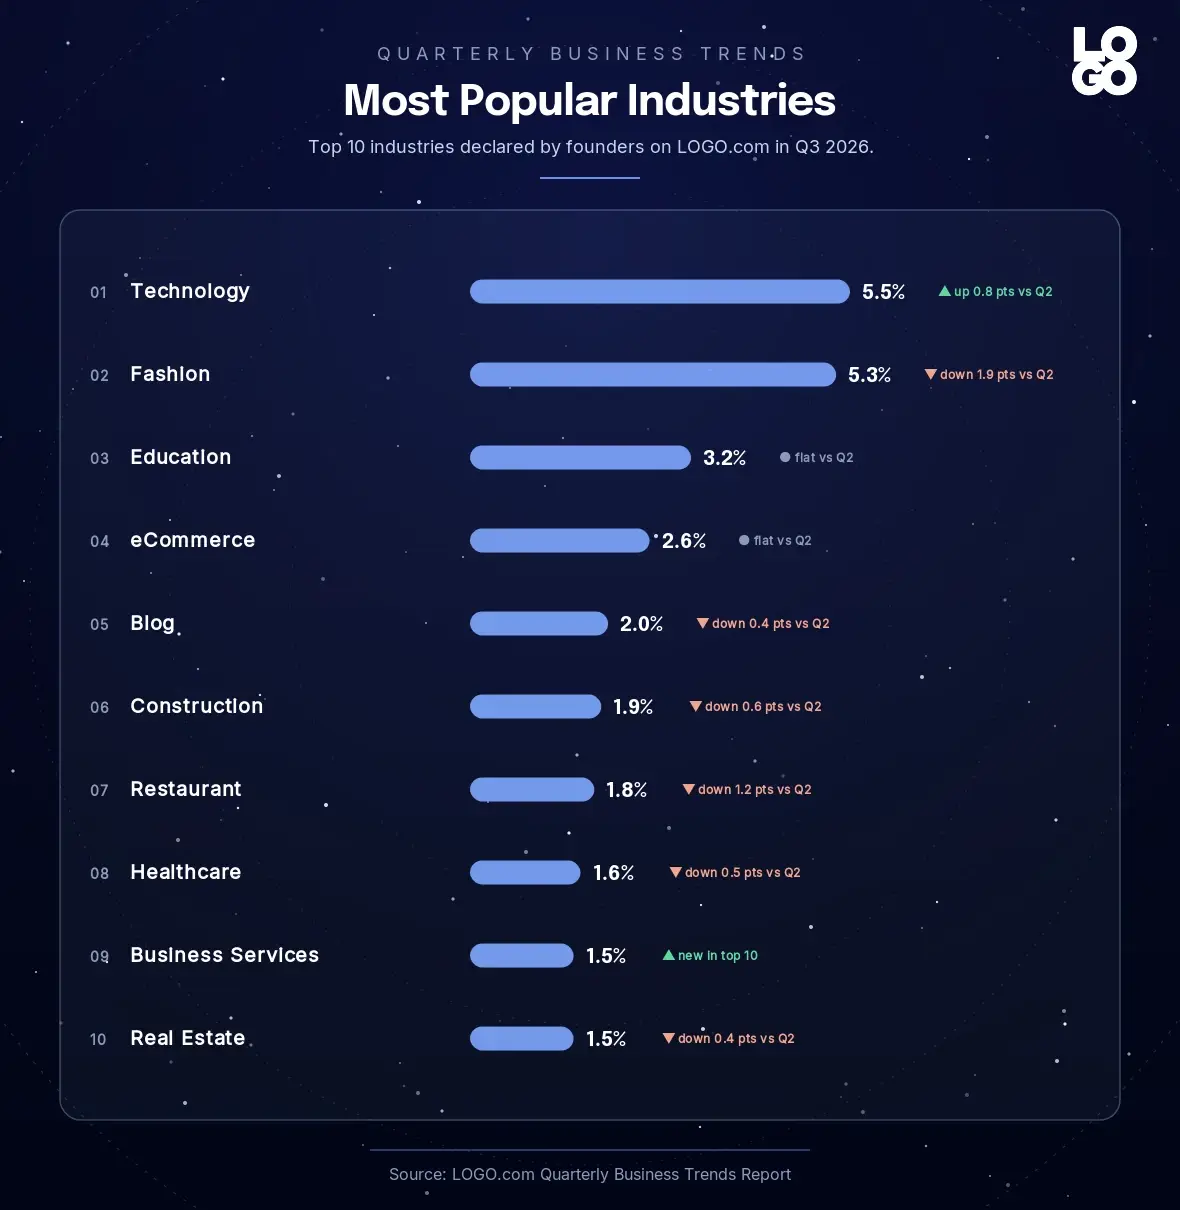
Technology led the field this quarter at 5.5 percent of industry selections, narrowly ahead of Fashion at 5.3 percent. Education held third at 3.2 percent, followed by eCommerce at 2.6 percent and Blog at 2.0 percent. Construction (1.9 percent), Restaurant (1.8 percent), Healthcare (1.6 percent), Business Services (1.5 percent), and Real Estate (1.5 percent) round out the top 10.
Compared to Q2 2026, the top of the leaderboard flipped. In Q2, Fashion led at 7.2 percent with Technology at 4.7 percent, the widest Fashion lead in the series. In Q3 Technology gained 0.8 points while Fashion gave back 1.9 points, and Technology took the number one spot for the first time since the series began. Education held exactly flat at 3.2 percent and kept third. Restaurant, the biggest gainer in Q2, gave back 1.2 points and slipped from fourth to seventh. Blog moved up two places to fifth even while easing back slightly, because the categories around it moved more.
What stood out in Q3 2026 that did not stand out in Q2: Business Services entered the top 10 for the first time at 1.5 percent, and Information Technology, a top 10 fixture in every prior report, dropped out of the ranking entirely. That exit is a product change rather than a founder change. The industry picker was reworked during the quarter, and from August founders who would previously have chosen Information Technology are landing in Technology, which explains part of Technology's gain. The same rework introduced a general Business option that drew 3.8 percent of selections by the end of the quarter. We leave it out of the ranking because it is a catch all rather than an industry, and we flag it here so the comparison stays honest.
Just outside the top 10 on the watch list, Financial Services sits at 1.3 percent, Consulting at 1.3 percent, Clothing Brand at 0.9 percent, and 3D Printing at 0.9 percent. Last quarter we predicted 3D Printing would enter the top 10. It did not. It slipped from 13th to 14th, and the category is better read as a durable niche than a breakout. Clothing Brand is the new arrival to watch, because combined with Fashion it points to apparel founders describing their business more specifically than before.
The combined share of the four biggest categories in Q3 2026, Technology, Fashion, Education, and eCommerce, is roughly 17 percent of all industry selections, compared with roughly 18 percent for the same four categories in Q2. The long tail widened only slightly, and the leaders traded places.
Most Popular Brand Colors in 2026
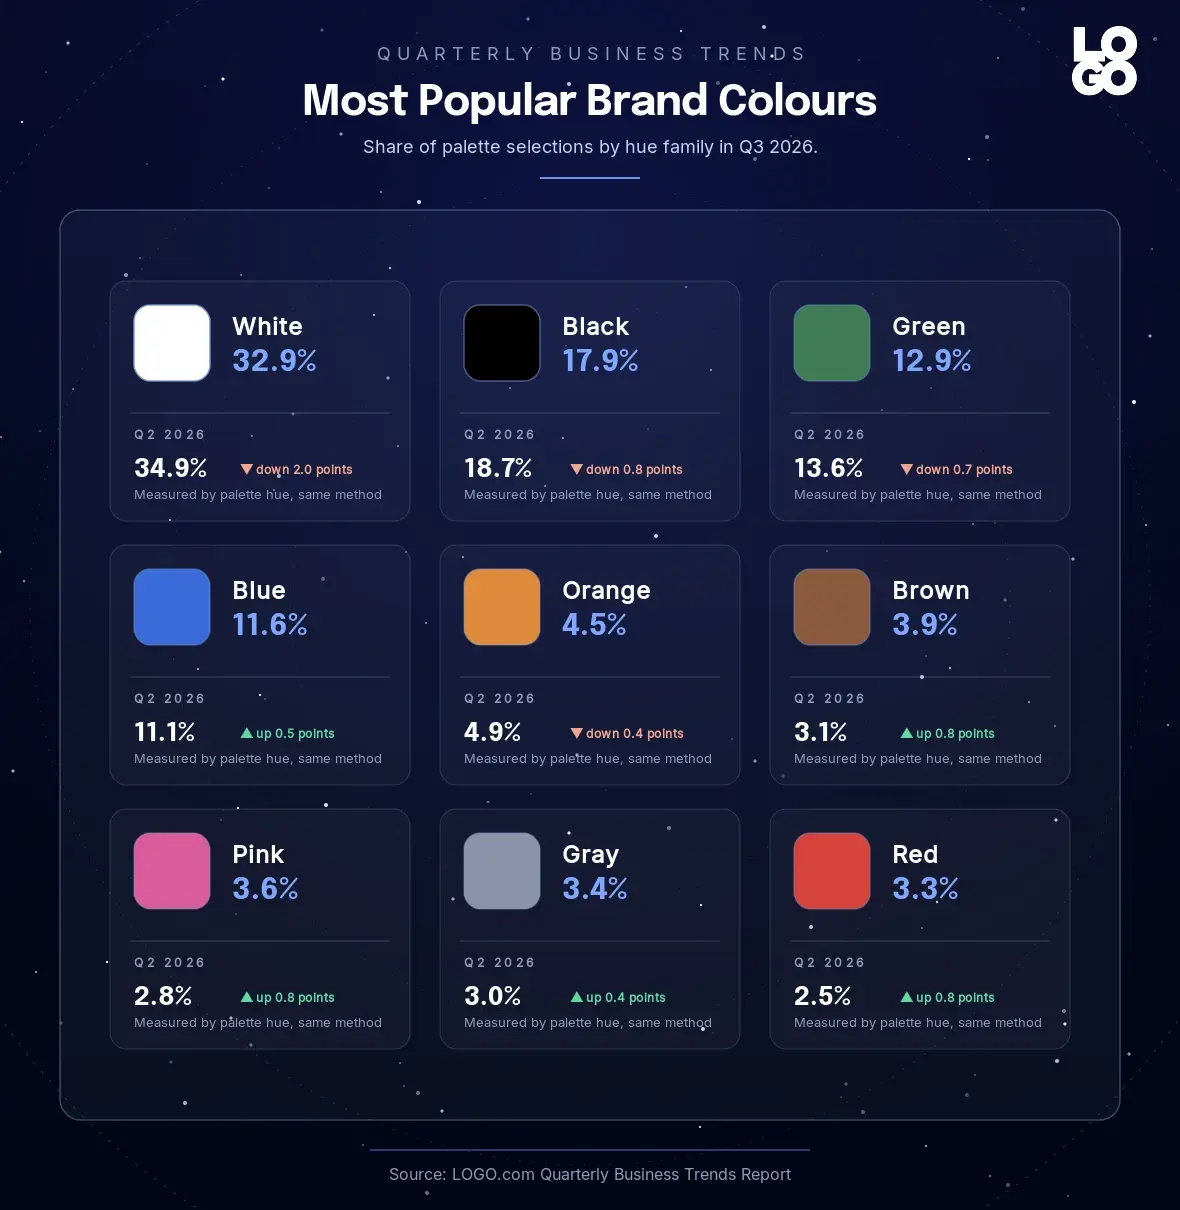
According to LOGO.com data, the share of palette selections by hue family in Q3 2026 (273,489 hue selections across 141,455 palettes) is led by white at 32.9 percent, followed by black at 17.9 percent. Green is the most popular non neutral hue at 12.9 percent, ahead of blue at 11.6 percent. Orange (4.5 percent), brown (3.9 percent), pink (3.6 percent), gray (3.4 percent), and red (3.3 percent) round out the top 9 in the image. Purple (3.2 percent) and yellow (2.7 percent) sit just outside the top 9.
White and black anchor 50.8 percent of all hue selections in Q3 2026, compared with 53.6 percent in Q2. Neutrals remain the load bearing choice in more than half of all palettes, but for the first time in the series they gave a little share back to the accent hues. Among non neutrals, the Q3 2026 leaderboard is Green, then Blue, then Orange, then Brown, the same order as both Q1 and Q2.
The quarter over quarter deltas are small but consistent in direction. White eased back 2.0 points and black 0.8 points, while brown gained 0.8, pink gained 0.8, red gained 0.8, blue gained 0.5, and gray gained 0.4. Green gave back 0.7 points. The hues that gained are warm and expressive, which fits a quarter where founders also reached for heavier, hand drawn icon styles.
The Green over Blue story is now four quarters long, but this is the first quarter the gap narrowed. Green led Blue by 2.0 points in Q1 and 2.5 points in Q2. In Q3 the gap is 1.3 points. We predicted the lead would widen for a third straight quarter, and it did not. Green still holds the top accent spot, and the Health, Restaurant, and Education mix that feeds it is intact, but Blue is gaining with the rise of Technology as the top declared industry. Red entering the top 9 for the first time is the other color story of the quarter, replacing purple.
Most Popular Logo Fonts in 2026
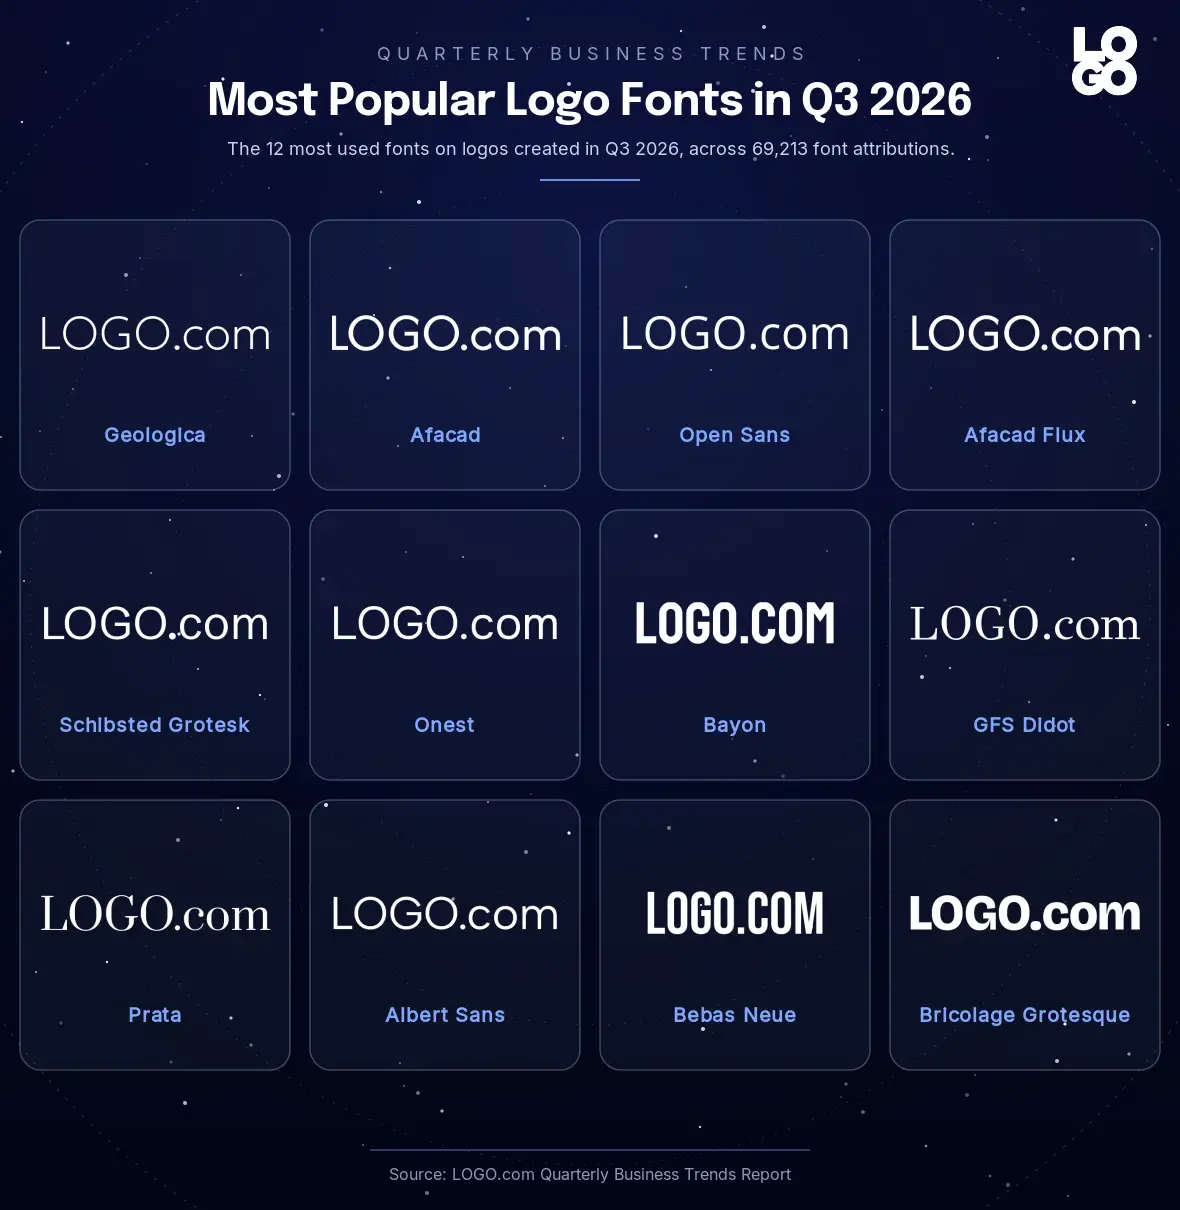
This is the first quarter where the font ranking can be compared like for like with the prior quarter, because both Q2 and Q3 measure the fonts attached to finished logos. Across 69,213 font attributions on the 50,126 logos created in Q3 2026 (a logo can carry more than one font across its wordmark and slogan), Geologica leads decisively at 13.4 percent, followed by Afacad (7.4 percent), Open Sans (5.3 percent), Afacad Flux (4.1 percent), Schibsted Grotesk (3.3 percent), Onest (3.1 percent), Bayon (2.4 percent), GFS Didot (2.4 percent), Prata (2.0 percent), Albert Sans (2.0 percent), Bebas Neue (2.0 percent), and Bricolage Grotesque (1.9 percent).
In Q2 2026 the same ranking was Geologica (15.1 percent), Afacad (7.8 percent), Afacad Flux (5.0 percent), Schibsted Grotesk (4.9 percent), Open Sans (3.6 percent), Prata (3.2 percent), Aboreto (3.0 percent), Bayon (2.6 percent), Albert Sans (2.2 percent), GFS Didot (2.2 percent), Darker Grotesque (2.2 percent), and DM Sans (2.1 percent).
Nine fonts carry across both quarters in the top 12, and the top two did not move. The movement is underneath them. Open Sans climbed from fifth to third, gaining 1.7 points, the largest gain of any font this quarter. Three faces entered the top 12: Onest, a rounded geometric sans, at sixth, and Bebas Neue and Bricolage Grotesque at eleventh and twelfth. Aboreto, Darker Grotesque, and DM Sans dropped out. Geologica gave back 1.7 points and Schibsted Grotesk 1.6, so the top of the list is a little less concentrated than it was.
Last quarter we noted that founders browse decorative but ship clean. Q3 makes the case more strongly. Open Sans, the most neutral workhorse on the list, is now the third most shipped font, and Onest and Bricolage Grotesque, both clean sans faces, arrived together. The one decorative counterweight is Bebas Neue, the tall condensed display face, which entered the top 12 at 2.0 percent. Pairing a bold condensed display face with a neutral geometric sans is a combination the data now supports from both ends.
How Many Icons Founders Tried Per Logo
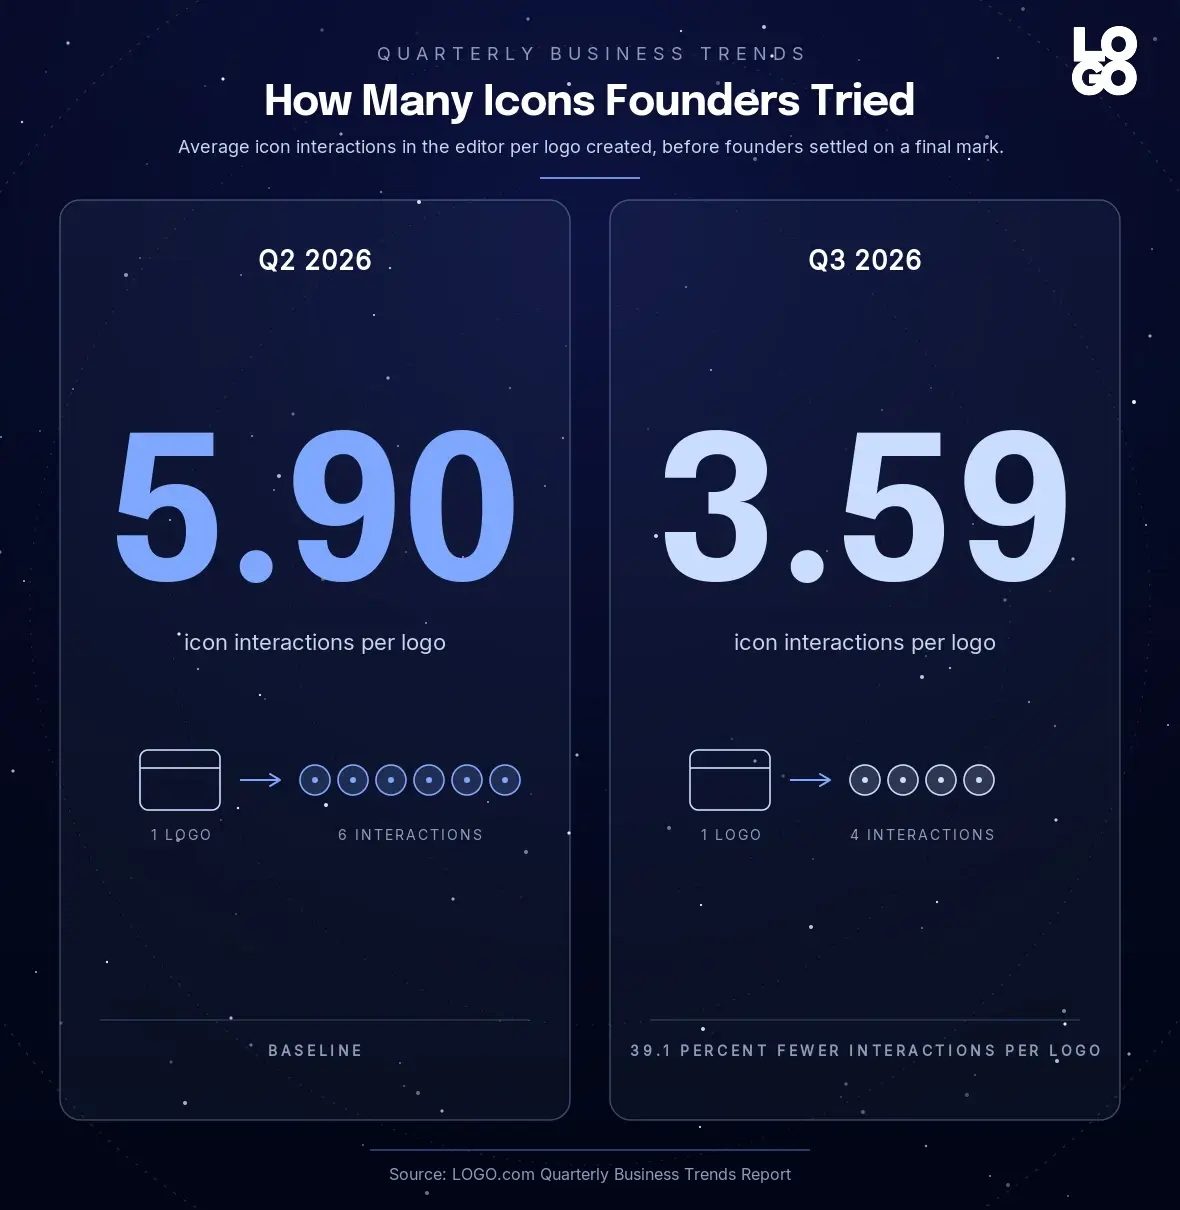
LOGO.com lets founders cycle through different icon options while building their logo, swapping symbols in and out until one feels right. A note on measurement first. The editor icon change event this series used through Q2 was retired in July 2026, so from this quarter the measure is icon interactions in the editor per logo created, and the Q2 figure is recomputed on the same basis.
In Q3 2026 founders averaged 3.59 icon interactions per logo (180,168 icon interactions across 50,126 logos created). In Q2 2026 the same average was 5.90 (699,505 icon interactions across 118,541 logos). Founders settled on their final mark with 39.1 percent fewer interactions per logo this quarter, the most decisive icon selection behavior the series has measured on this metric.
That decisiveness arrives in the same quarter that the custom icon style menu re expanded from eight options to twelve, which is the opposite of what we expected. More styles did not mean more browsing. One explanation is that the four returning styles (Playful, Retro, Pixel, and Deco) are distinctive enough that founders who want them know it immediately, so the wider menu sorts people faster rather than slower.
A reasonable interpretation: the Q2 founder tried many icons because the curated set of eight made every option plausible. The Q3 founder sees a wider range, recognizes their lane, and commits. Either way, the deliberate icon selection moment still exists, it just resolves in fewer steps than it did three months ago.
Most Popular Custom Icon Styles in Q3 2026
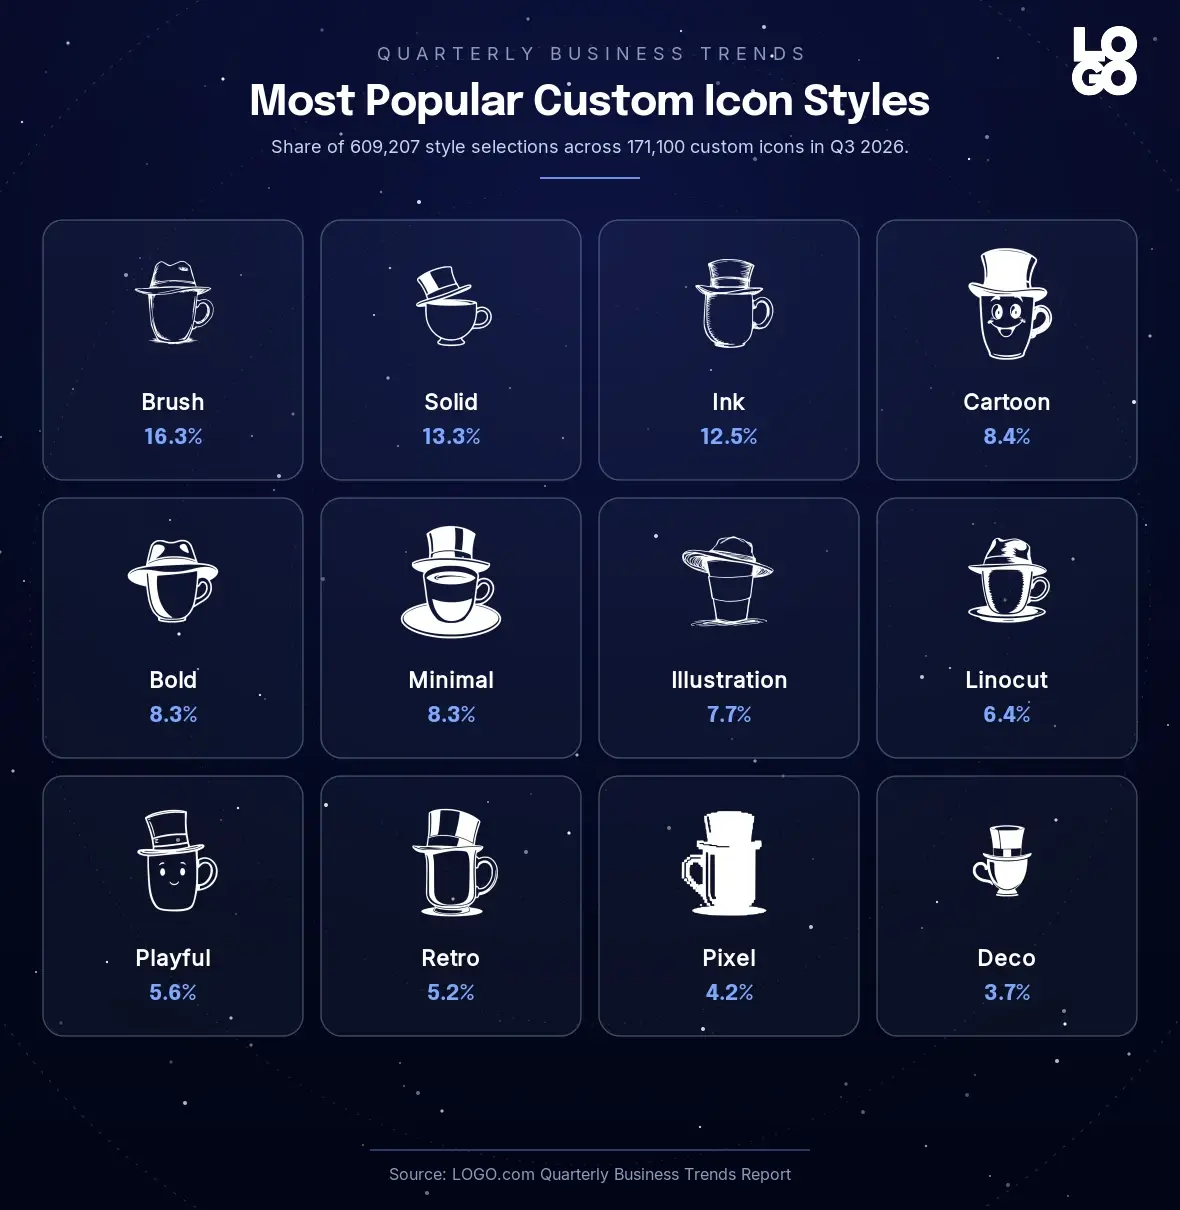
This quarter founders generated 171,100 custom icons and made 609,207 style selections across the custom icon flow. The top styles were Brush (99,400 selections), Solid (80,742), Ink (76,413), Cartoon (50,930), Bold (50,864), Minimal (50,639), Illustration (46,629), Linocut (39,206), Playful (34,204), Retro (31,440), Pixel (25,644), and Deco (22,842). Together these twelve account for more than 99 percent of all style selections in Q3.
The structural story reversed from last quarter. In Q2 the style menu had consolidated to eight core options and Playful, Retro, Pixel, and Deco had each collapsed to a fraction of a percent. In Q3 all four returned at real volume, and between them they took 18.7 percent of style selections. Playful, which was effectively retired at 0.3 percent in Q2, is back at 5.6 percent and ninth overall.
Inside the active set the lead changed hands again. Brush, which led in Q1, slipped to third in Q2, and is now first at 16.3 percent. Solid held second at 13.3 percent and Ink moved up from fourth to third. Bold, which rose to second in Q2 on the back of the consolidated menu, slipped to fifth at 8.3 percent. Last quarter we predicted Solid and Bold would hold the top two and push past 35 percent combined. They did not. Their combined share is 21.6 percent, and the hand drawn organic look of Brush and Ink is back on top with 28.9 percent between them.
Minimal sits sixth at 8.3 percent, within a tenth of a point of Bold and Cartoon. Three quarters of data now support the same conclusion: flat geometric minimalism is a steady mid table pick, not the dominant preference the design press narrative suggests. The styles founders reach for first lead with texture and weight, and when the menu widens, the textured end of the spectrum is where the share goes.
What Founders Are Describing for Custom Icons
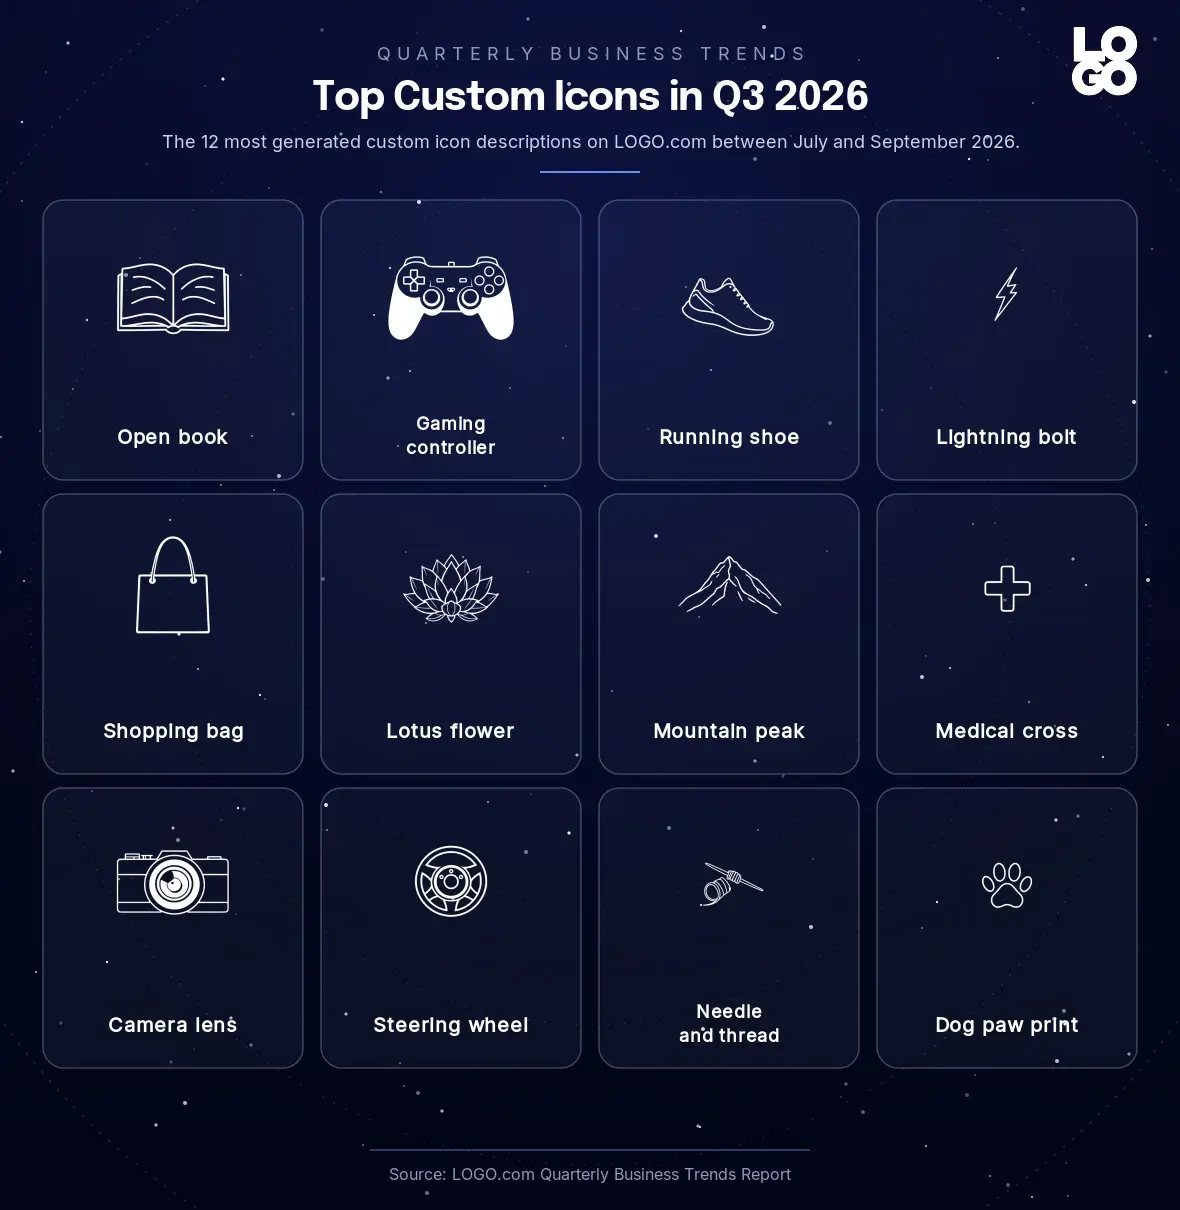
According to LOGO.com data, the most common themes inside custom icon descriptions in Q3 2026 are a mix of industry signifiers and trust symbols. Across the top 20 themes pulled from custom icon descriptions, Clothing leads at 7.7 percent, followed by House (6.3 percent), Book (6.0 percent), Shield (5.9 percent), Building (5.4 percent), Geometric (5.4 percent), Abstract (5.4 percent), Digital (5.2 percent), Camera (4.8 percent), and Construction (4.8 percent). Star, Network, Fashion, Circuit, Document, Briefcase, Truck, Leaf, Head, and Blueprint round out the top 20.
These descriptions cluster into three groups. First, industry signifiers like clothing, fashion, house, building, construction, camera, and truck, which map directly to the top declared industries above. Second, a new trust and professionalism cluster that was barely visible in Q2: shield, document, briefcase, network, and circuit, the visual vocabulary of insurance, consulting, and technology brands. Third, specific physical objects founders attach to a brand mark. The top single object descriptions in Q3 2026 were Open book, Gaming controller, Running shoe, Lightning bolt, Shopping bag, Lotus flower, Mountain peak, Medical cross, Camera lens, Steering wheel, Needle and thread, and Dog paw print, with Wooden cabinet door and Steel construction beam just behind them as reminders that trades founders describe the literal materials of their work.
The Q3 2026 corpus is more abstract than Q2. Last quarter founders described things you could hold, drive, or mow with. This quarter Geometric, Abstract, Digital, Network, and Circuit all sit in the top 20, which tracks the rise of Technology as the top declared industry and the arrival of Business Services in the top 10. A second shift is in how founders describe at all. A growing share of descriptions arrive as short keyword sets like shield, document, handshake or star, spark, leaf rather than full sentences, which suggests founders are building icons from a few anchor concepts rather than a single picture. This is unique data. Other logo and design publications do not have access to a corpus of custom icon descriptions at this scale.
Most Popular Business Name Words in Q3 2026
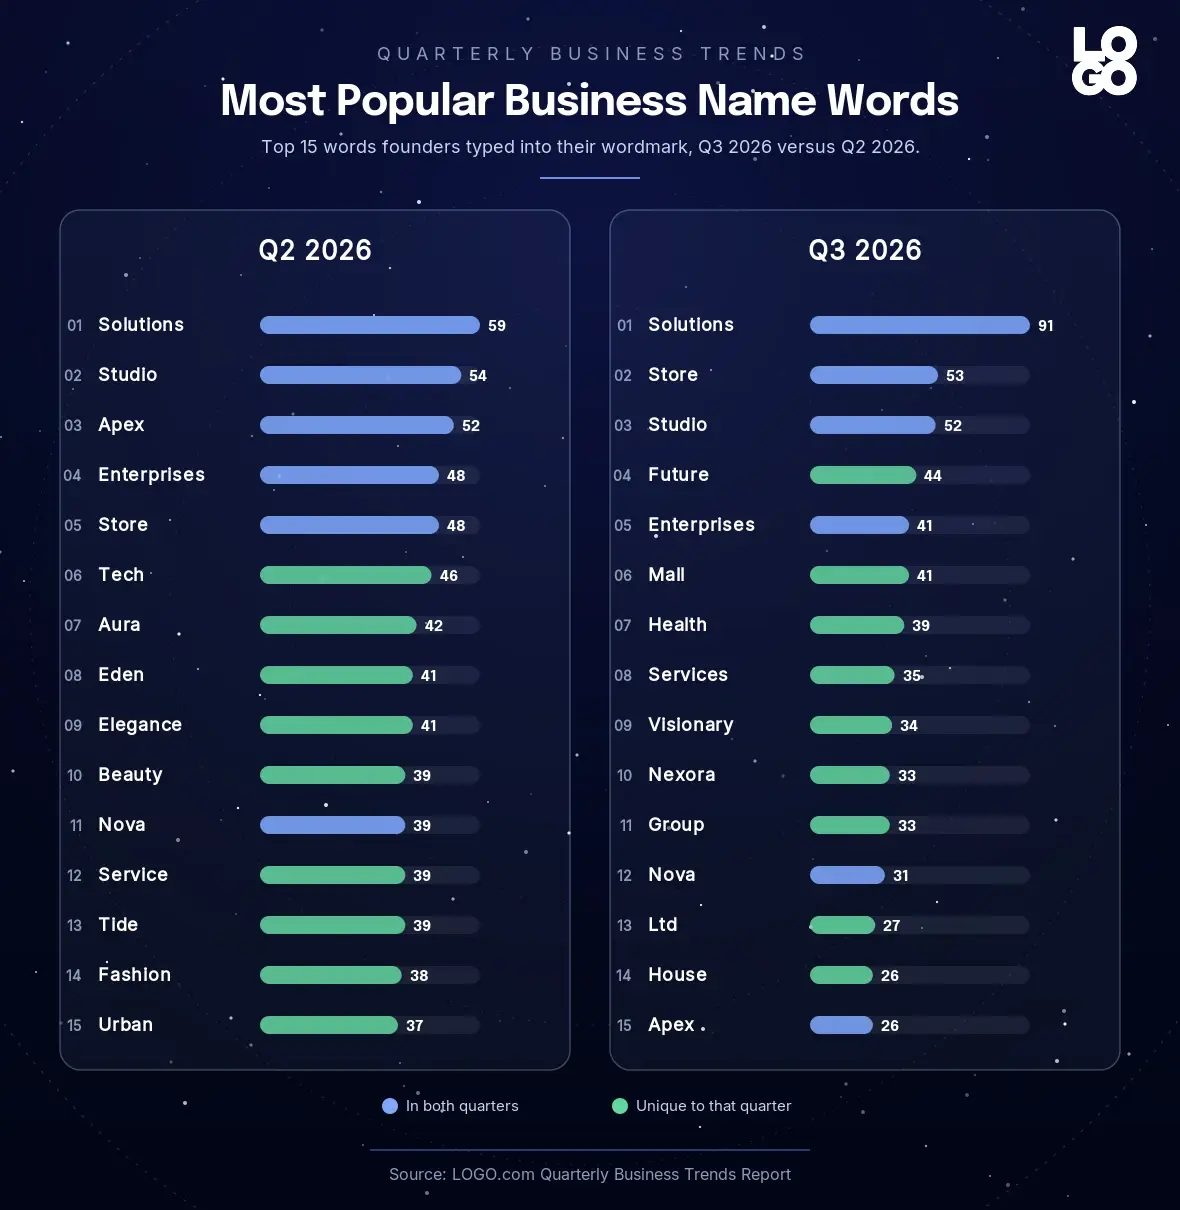
When founders type their brand name into the LOGO.com editor in Q3 2026, the most repeated word across the top of the wordmark distribution is Solutions (91 occurrences), followed by Store (53), Studio (52), Future (44), Enterprises (41), Mall (41), Health (39), Services (35), Visionary (34), Nexora (33), Group (33), Nova (31), Ltd (27), House (26), and Apex (26), with LLC tied with the last two at 26. After dropping placeholder strings, template names, stopwords, and one or two character tokens, these are the actual words founders chose to put on their logo.
The Q2 2026 list looked different in its back half. Last quarter the most repeated wordmark words were Solutions (59 occurrences), Studio (54), Apex (52), Enterprises (48), Store (48), Tech (46), Aura (42), Eden (41), Elegance (41), Beauty (39), Nova (39), Service (39), Tide (39), Fashion (38), and Urban (37).
Six words carry across both quarters in the top 15: Solutions, Store, Studio, Enterprises, Nova, and Apex. The story is in what changed. Future, Mall, Health, Services, Visionary, Nexora, Group, Ltd, and House entered the top 15 in Q3 2026. Tech, Aura, Eden, Elegance, Beauty, Service, Tide, Fashion, and Urban all dropped out.
The quarter on quarter pattern is a swing back from aesthetic naming toward corporate naming. Q2 added a lifestyle register with Aura, Beauty, Elegance, and Urban. Q3 replaced it almost word for word with the language of incorporation: Group, Ltd, LLC, Services, Enterprises, and Solutions, which held the number one spot for a third straight quarter and widened its lead. Founders naming a business this quarter were naming a company, not a brand mood.
Two returns deserve a flag. Visionary, a top three business name word in Q4 2025 and Q1 2026 that dropped out entirely in Q2, is back in the top 10. And Future, which has been a fixture of the slogan list for four quarters, crossed over into business names for the first time at fourth, driven by names like Future Mall. Nexora is the one invented name in the list, a sign that founders are also reaching for coined, available sounding words when the descriptive ones are taken.
Most Popular Slogan Words in Q3 2026
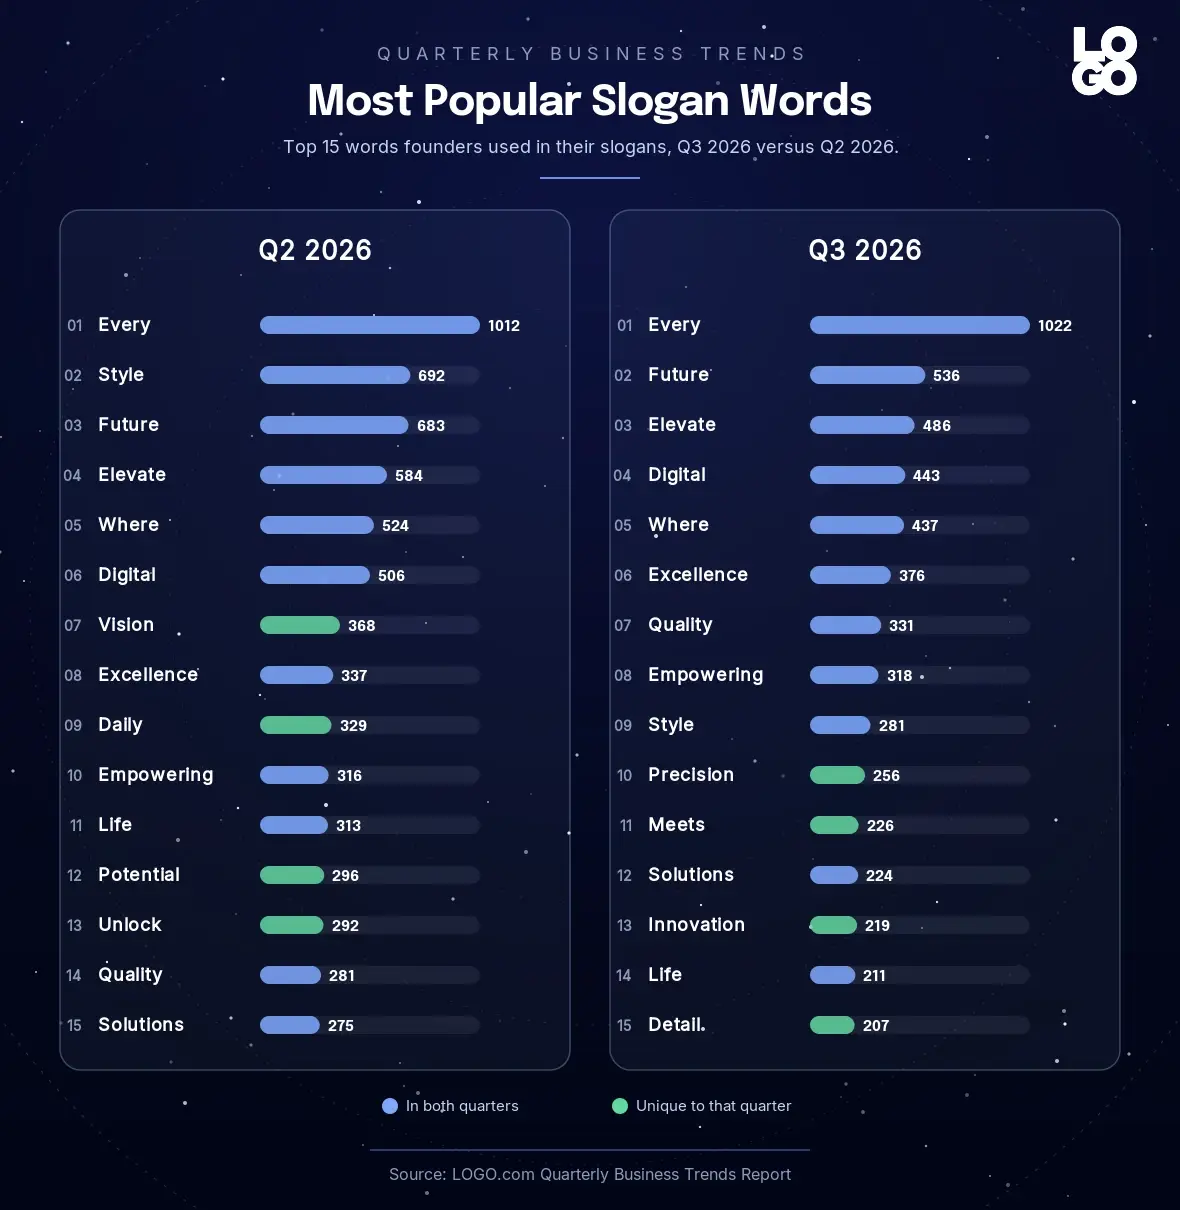
Across the slogans founders attached to the 50,126 logos created in Q3 2026, the most frequently typed words were Every (1,022 occurrences), Future (536), Elevate (486), Digital (443), Where (437), Excellence (376), Quality (331), Empowering (318), Style (281), Precision (256), Meets (226), Solutions (224), Innovation (219), Life (211), and Detail (207).
In Q2 2026 the same analysis produced Every (1,012), Style (692), Future (683), Elevate (584), Where (524), Digital (506), Vision (368), Excellence (337), Daily (329), Empowering (316), Life (313), Potential (296), Unlock (292), Quality (281), and Solutions (275).
Eleven words carry across both quarters in the top 15: Every, Future, Elevate, Digital, Where, Excellence, Quality, Empowering, Style, Life, and Solutions. These remain the durable slogan building blocks, the canonical "elevate your X" and "excellence in every Y" cadence founders return to regardless of category.
The change is in the register of what came in and what fell out. Q3 2026 added Precision, Meets, Innovation, and Detail to the top 15. Q2 had Vision, Daily, Potential, and Unlock. The Q2 additions were aspirational. The Q3 additions are craft words, the language of exactness and delivery, and they pair with slogans like Excellence in Every Detail and Building Your Vision With Precision that were among the most repeated complete slogans of the quarter. Founders moved from promising a feeling in Q1, to promising a level of service in Q2, to promising precision in Q3.
Two specific words deserve a flag. Every held first for a second straight quarter and widened its lead, now appearing nearly twice as often as the next word. And Style, the top slogan word of Q1 and second in Q2, slid to ninth, the clearest sign yet that the fashion forward register has cooled in slogans even as apparel founders describe their businesses more specifically.
Most Popular Slogan Tones in Q3 2026
A note on scope first. The standalone slogan tool was wound down during Q3 2026, so tone data this quarter covers 4,819 slogan generations, most of them in July, and 2,087 of those carried a usable tone tag. The shares below are of that tagged pool, which is the same basis as prior quarters.
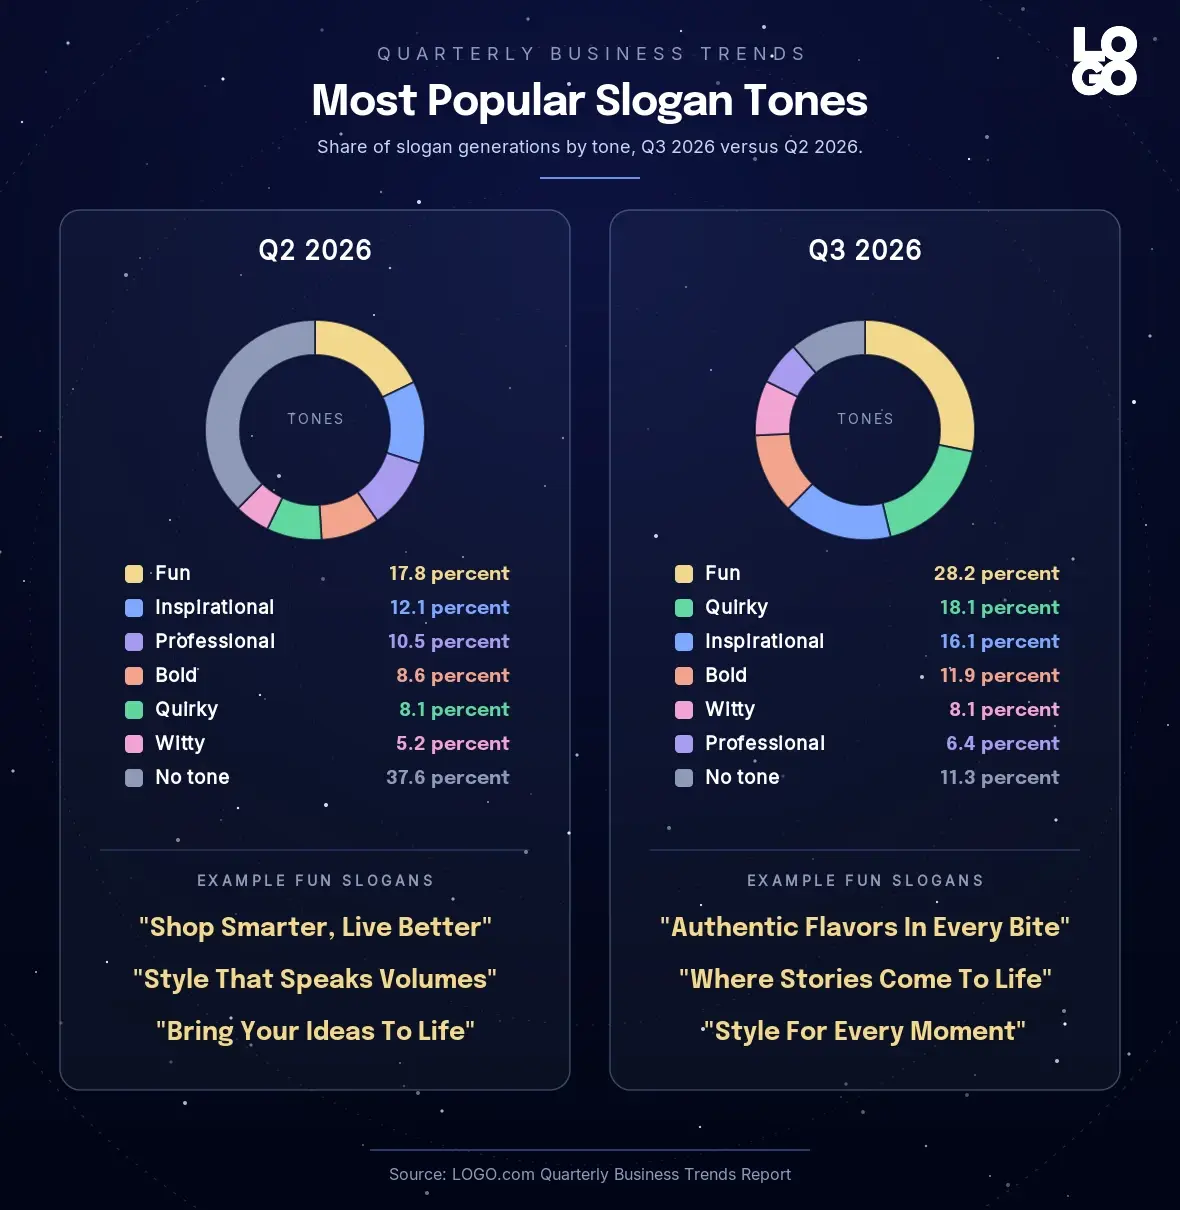
When founders specifically picked a tone in Q3 2026 the most common was fun (28.2 percent of tone tagged slogans), followed by quirky (18.1 percent), inspirational (16.1 percent), bold (11.9 percent), witty (8.1 percent), and professional (6.4 percent). Only 11.3 percent of tone tagged generations carried no specific tone, the lowest no tone share in the series.
Q2 2026 looked different. When founders picked a tone in Q2, Fun was the most common (17.8 percent), followed by Inspirational (12.1 percent), Professional (10.5 percent), Bold (8.6 percent), Quirky (8.1 percent), and Witty (5.2 percent). The no tone share was 37.6 percent in Q2 versus 11.3 percent in Q3, so founders who used the tool this quarter nearly always chose a voice.
Two shifts stand out. Fun held first and gained 10.4 points, the largest single tone move in the series. And Quirky jumped from fifth to second, gaining 10.0 points, while Professional fell from third to last. Last quarter we noted the personality tones were gaining at the expense of the earnest ones. In Q3 that trend went all the way: Fun, Quirky, and Witty together account for 54.4 percent of tagged slogans, up from 31.1 percent in Q2.
The founders who used the slogan tool in its final quarter treated it as a voice experiment rather than a formality, and they experimented toward playfulness. With the standalone tool retired, future reports will read slogan tone from the slogans attached to finished logos instead.
Products Founders & Business Owners Want Most
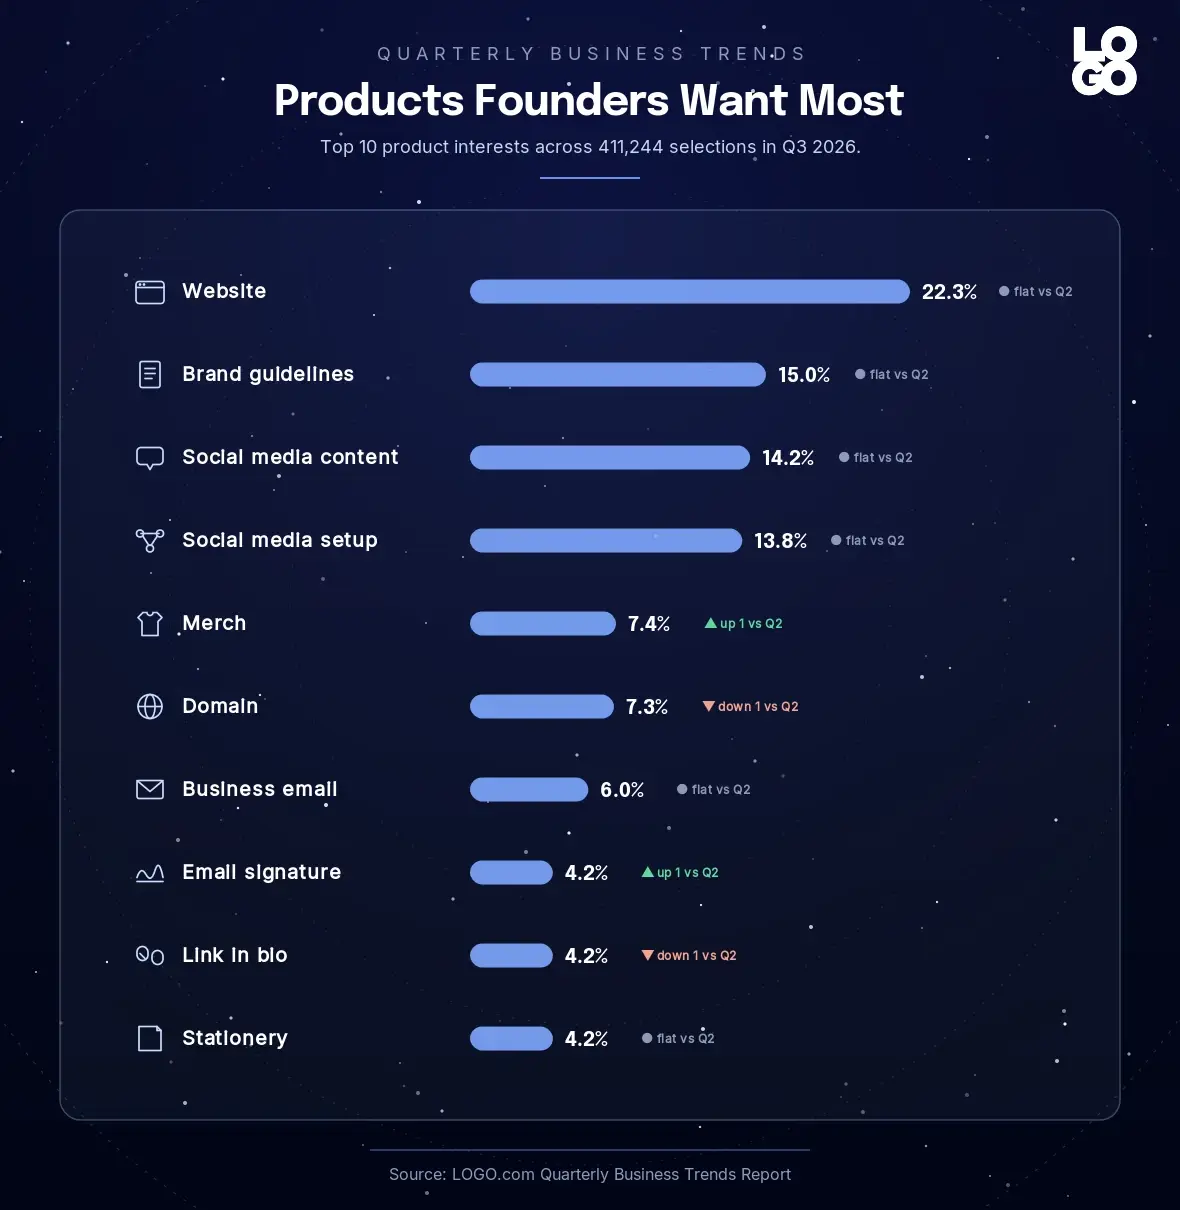
Across 411,244 product interest selections in Q3 2026, a website was the single most wanted product after a logo (22.3 percent), followed by brand guidelines (15.0 percent), social media content (14.2 percent), and social media setup (13.8 percent). Combined, these four account for 65.3 percent of all stated product interest this quarter, in line with the 66 percent they held in Q2.
After those four, merch sits at 7.4 percent, a domain at 7.3 percent, business email at 6.0 percent, email signature at 4.2 percent, link in bio at 4.2 percent, and stationery rounding out the top 10 at 4.2 percent.
The Q2 2026 ranking had the same four leaders, with website at 21.1 percent, brand guidelines at 18.0 percent, social media content at 14.0 percent, and social media setup at 12.7 percent, followed by a domain at 7.4 percent and merch at 7.0 percent.
Three shifts. Website gained 1.2 points and widened its lead at the top for a third straight quarter. Brand guidelines gave back 3.0 points, reversing all of its Q2 gain, and the two social media products closed the gap on it to within a point. And merch edged past the domain to retake fifth, reversing their Q2 order, which is notable because it moved opposite to the post logo behavior below, where domain activity gave share to websites. Email signature, link in bio, and stationery are separated by fewer than 70 selections at the bottom of the list.
The pattern across all four quarters of this series confirms the same headline: new founders are thinking digital first. Storefront assets like stationery and email signatures sit at the bottom of the list. A website, a brand kit, and a social presence sit at the top, and the website's lead is growing.
What Founders Built After Their Logo
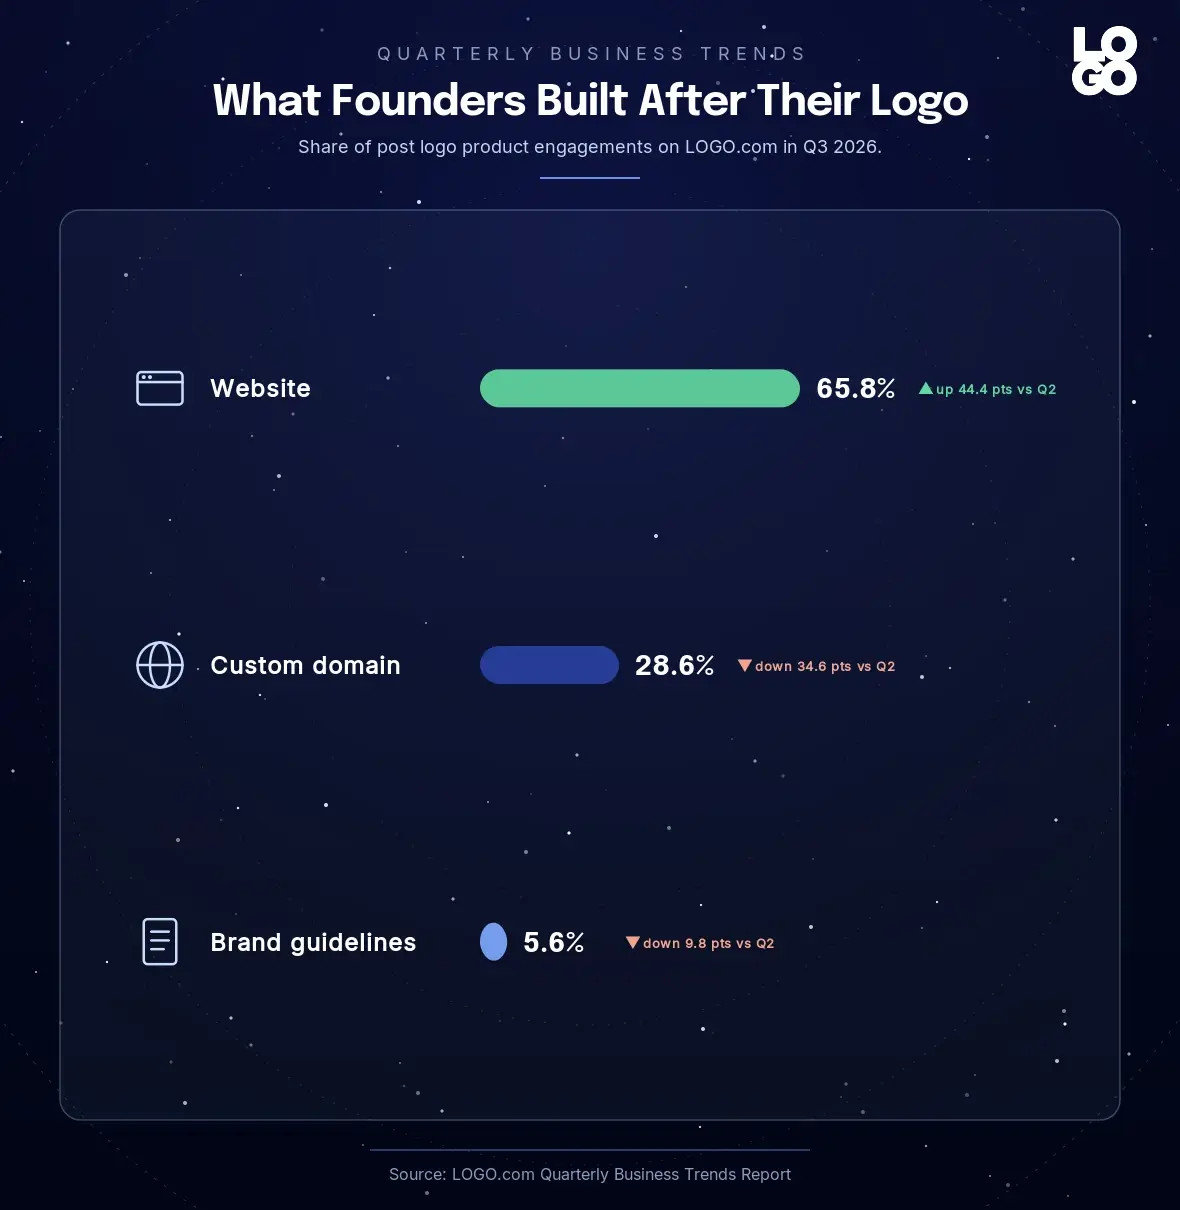
After creating a brand on LOGO.com in Q3 2026, the most engaged next step was publishing a one page website (65.8 percent of post logo product engagements). Claiming a domain was the second most engaged (28.6 percent), followed by clicking into brand guidelines (5.6 percent).
The ordering is the news. In every prior report, claiming a domain was the number one post logo step, and in Q2 it held 63.2 percent of engagements with websites a distant second at 21.4 percent. In Q3 the two swapped places. Websites gained 44.4 points of share and domains gave back 34.6 points. Founders published 3,962 one page websites this quarter, and for the first time in the series the published site, rather than the claimed name, is what founders do first.
Brand guidelines completed the slide that began in Q2, moving from 42.7 percent of engagements in Q1 to 15.4 percent in Q2 to 5.6 percent now. The brand kit remains a real step in the founder journey, but the data says it is a later step. Across Q3, 94.4 percent of post logo engagement went toward standing up a live web presence, either a published site or a domain, up from 84.6 percent in Q2. We predicted websites would hold above 20 percent of post logo engagements. They more than tripled that bar.
Most Popular Domain Endings in 2026
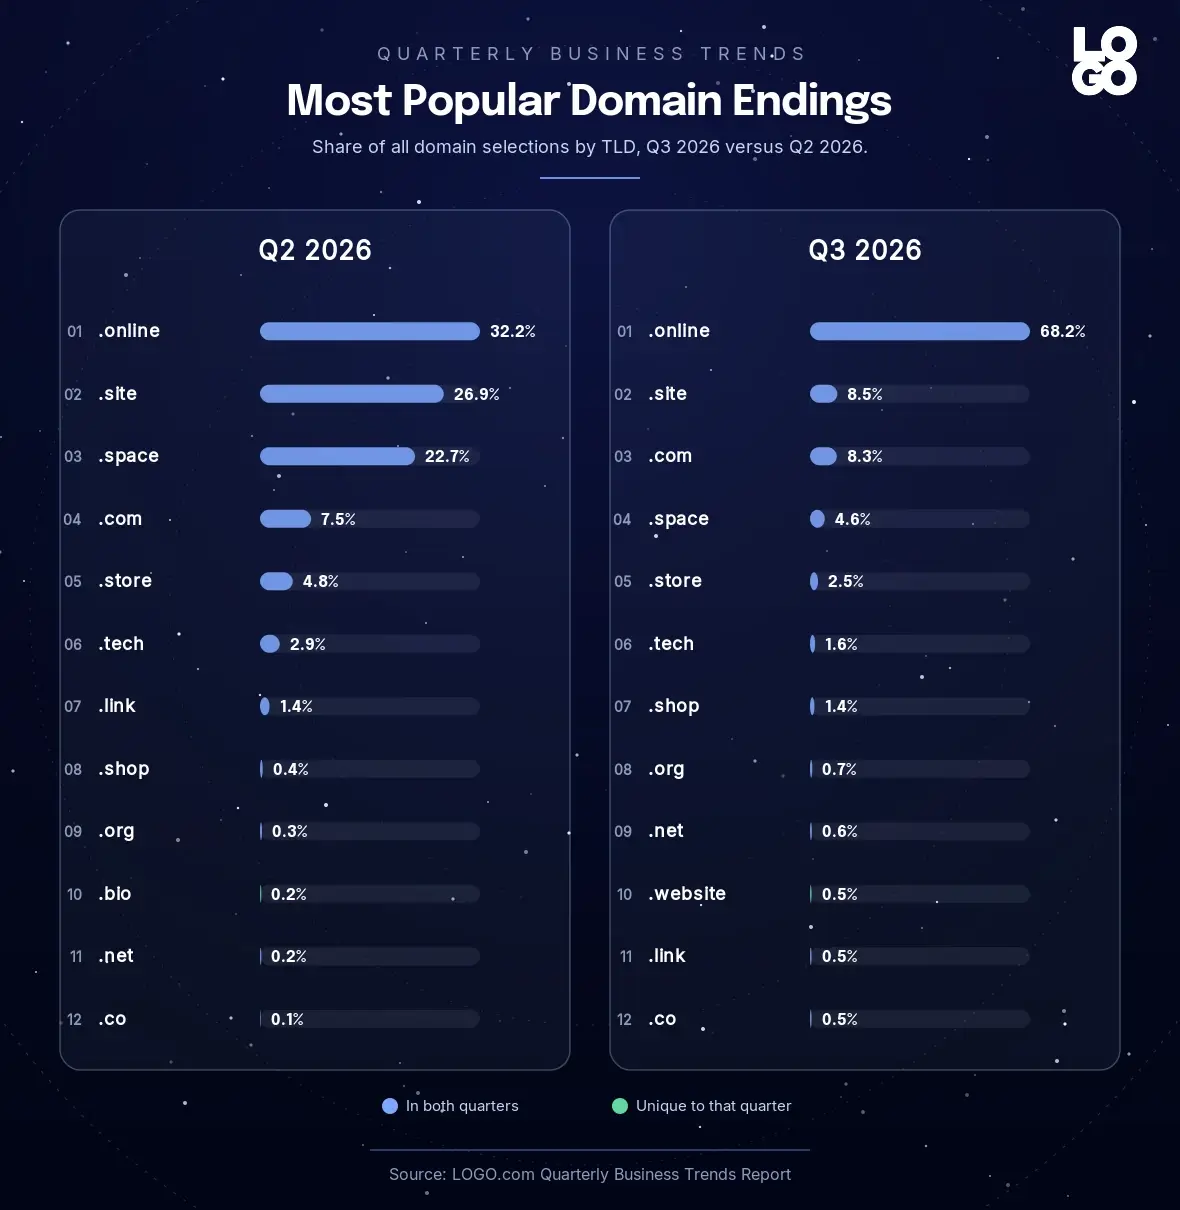
Of all domain selections by founders in Q3 2026, .online was the most picked TLD at 68.2 percent of selections, far ahead of .site (8.5 percent), .com (8.3 percent), .space (4.6 percent), and .store (2.5 percent). .tech (1.6 percent), .shop (1.4 percent), .org (0.7 percent), .net (0.6 percent), .website (0.5 percent), .link (0.5 percent), and .co (0.5 percent) round out the top 12.
Q2 2026 was a three way race. Last quarter .online led at 32.2 percent, followed by .site (26.9 percent), .space (22.7 percent), .com (7.5 percent), .store (4.8 percent), .tech (2.9 percent), .link (1.4 percent), .shop (0.4 percent), .org (0.3 percent), .bio (0.2 percent), .net (0.2 percent), and .co (0.1 percent).
The race is over for now. .online more than doubled its share and took more than two thirds of all selections, while .site and .space, its Q2 rivals, gave back 18.4 and 18.1 points respectively. The top three descriptive endings still hold 81.3 percent of selections between them, almost exactly their 81.8 percent in Q2, so the descriptive alternative ending pattern held even as the share inside it concentrated on one TLD. .com moved up from fourth to third, and .shop and .org both recovered a little from their Q2 lows.
That durable signal is the one we predicted last quarter, and it held for a third straight quarter. .com stayed below 10 percent of selections at 8.3 percent, up slightly from 7.5 percent in Q2 but still a distant third. Among LOGO.com founders in Q3 2026, more than nine in ten domain selections went to an ending other than .com. For new businesses being created right now, the default web address is a descriptive alternative ending, and this quarter it was overwhelmingly .online.
Q4 2026 Predictions
Five predictions for Q4 2026, each tied directly to a Q3 2026 signal in the data above. Each prediction is testable when we publish the next quarterly report. For accountability: of the five predictions we made last quarter, the websites above 20 percent call and the .com below 10 percent call landed, while the Solid and Bold call, the Green widening its lead call, and the 3D Printing top 10 call missed, which we covered in their sections.
First, websites will hold the number one post logo step for a second straight quarter and stay above 50 percent of post logo engagements. The swap from domains to websites was 44 points wide, which is far too large to be a one quarter wobble.
Second, Technology will hold the top declared industry over Fashion. The industry picker rework that folds Information Technology into Technology is structural, and the Business Services and Clothing Brand arrivals both point to founders describing their category more specifically, which splits Fashion rather than Technology.
Third, Brush and Ink will keep the hand drawn organic look in the top three custom icon styles with a combined share above 25 percent. They hold 28.9 percent now, and the re expanded style menu has stopped the churn at the top that the consolidation caused in Q2.
Fourth, .com will stay below 10 percent of domain selections for a fourth straight quarter, and .online will remain the single most picked ending. Even if .site and .space recover some share, the concentration this quarter was too decisive to unwind fully in three months.
Fifth, the corporate naming register will hold. Solutions will stay the number one business name word for a fourth straight quarter, and at least three of Group, Ltd, LLC, Services, and Enterprises will remain in the top 15.
Methodology
The Q3 2026 sample for this report includes 50,126 logos created, 417,271 business stage selections, 141,455 palette selections, 411,244 product interest selections, 171,100 custom icons generated, 4,819 slogan generations, and 69,213 font attributions on created logos between July 1 and September 30, 2026, drawn globally. Comparisons reference 118,541 logos and the matching event counts for Q2 2026 (April 1 to June 30, 2026). All counts come from LOGO.com product analytics.
Most figures are reported as percentages of their category so comparisons between quarters stay fair. Where Q2 2026 data is not directly comparable to Q3 2026, we flag it in the relevant section and compare patterns rather than raw shares. Three measurement changes apply this quarter. Founder types are read from the business stage selection step for both quarters because the separate brand creation event stopped emitting during June and July. Icons tried per logo now uses icon interactions in the editor for both quarters because the editor icon change event was retired in July 2026. And slogan tone covers the 4,819 generations made before the standalone slogan tool was wound down, while slogan words are drawn from the slogans attached to finished logos. The industry ranking excludes the new general Business option introduced during the quarter, and notes that Information Technology selections were folded into Technology from August.
This is a measure of where new brand activity is concentrating on our platform, not a measure of which industries grew fastest in the wider economy.
Cite This Report
Quarterly Business Trends Report, Q3 2026. First party data drawn from 50,126 logos created on LOGO.com between July 1 and September 30, 2026, benchmarked against 118,541 logos created in Q2 2026. Source: LOGO.com. Citation: "LOGO.com Quarterly Business Trends Report, Q3 2026, logo.com/blog/quarterly-business-trends-july-sept-2026."
Recent posts
Oct 19, 2026 by: Sean Baker
Oct 14, 2026 by: Vanessa Lam
Oct 12, 2026 by: Sean Baker
Oct 5, 2026 by: Sean Baker