Quarterly Business Trends Report: January to March 2026
LOGO.com’s Q1 2026 report analyzes 163,414 new logos and millions of related data points to reveal how and where new businesses are being built, what their brands look like, and which products and domains founders choose first.
Every quarter, hundreds of thousands of people sit down to start a business and many of them begin by creating a brand. Between January 1 and March 31, 2026, LOGO.com saw 163,414 logos created. Founders on the platform generated 412,801 unique custom icons, 562,742 palette selections, 98,110 font choices, and 75,191 slogan generations during the same window.
This report is built for founders, agencies, journalists, and educators who need a current view of how new businesses are being built. According to LOGO.com data, here is what Q1 2026 looked like, and how it compared to Q4 2025.
The Q1 2026 New Business Profile
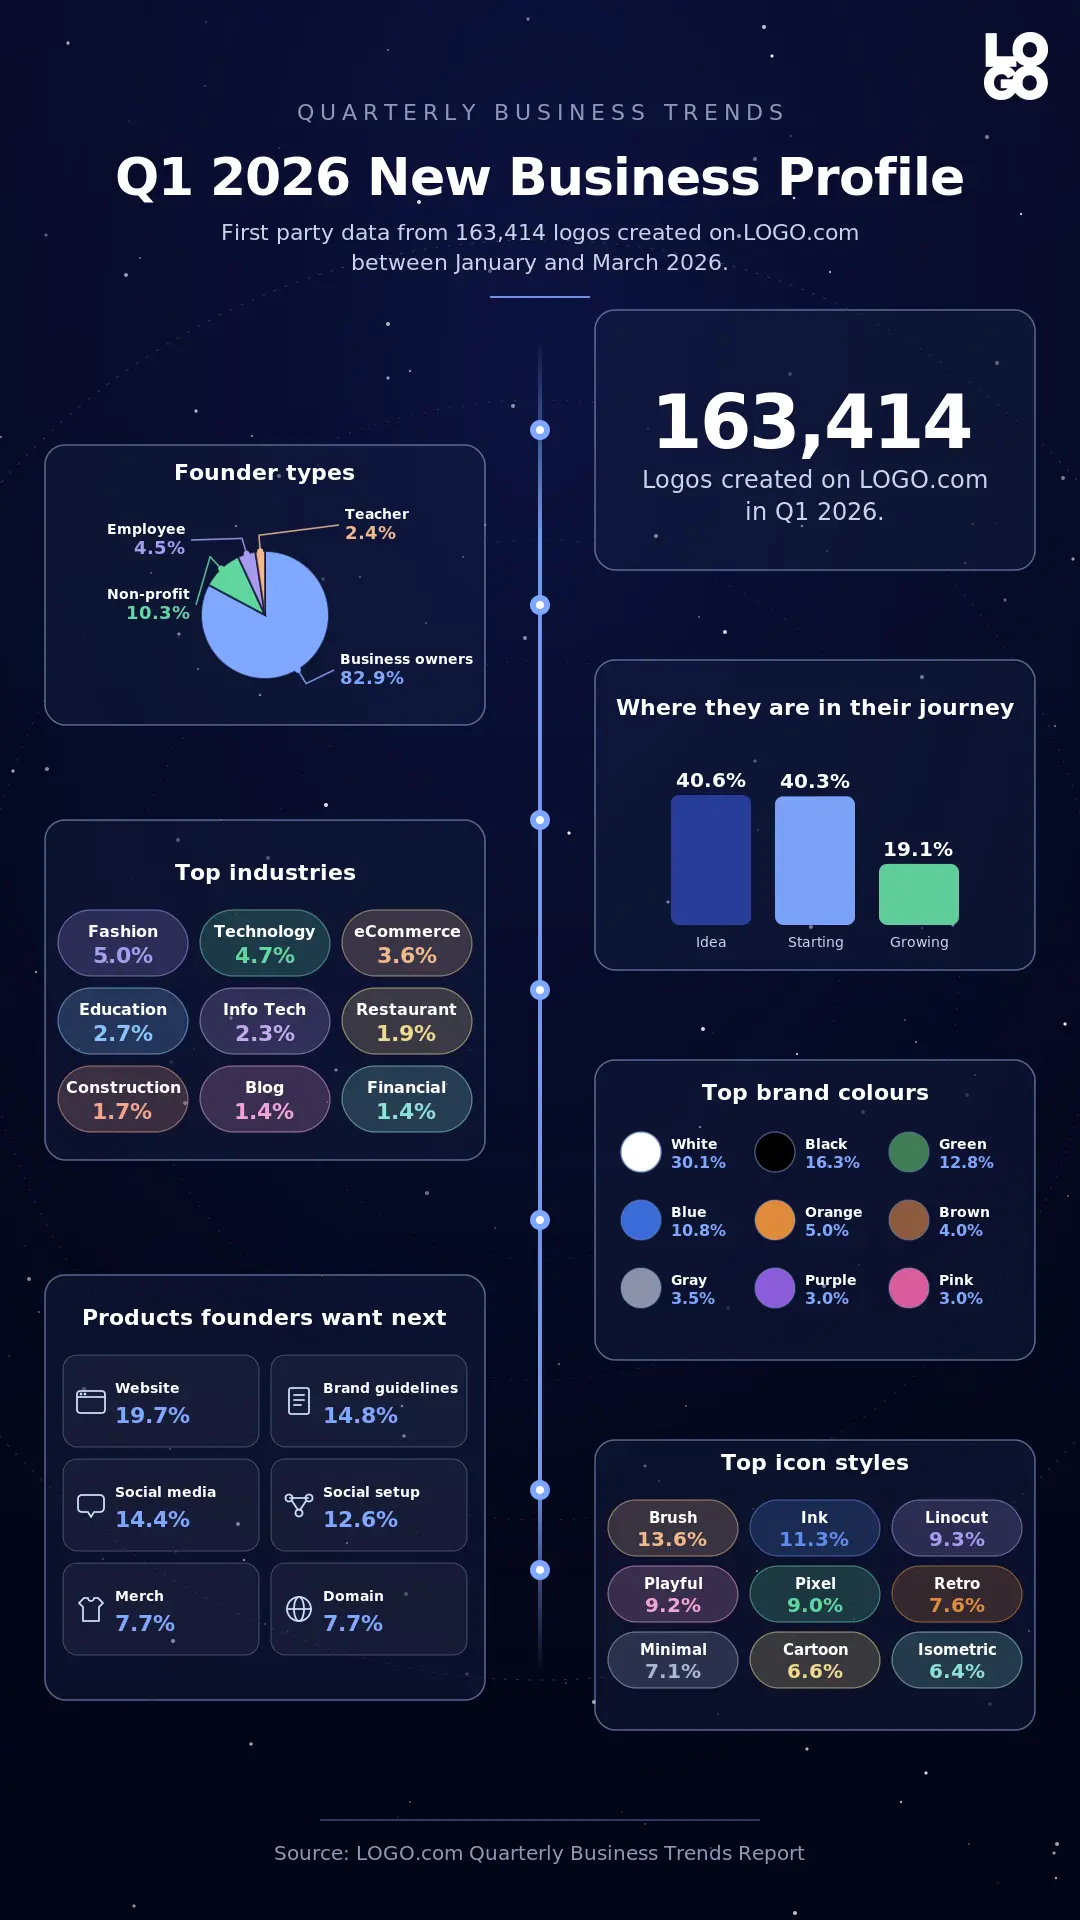
Compiled from the most common values across Q1 2026 brands, the typical new founder on LOGO.com this quarter looks like this:
- Self description: Business owner (66.9 percent of brand creators, excluding students and personal use)
- Business stage: Idea phase, narrowly ahead of those actively starting a business (40.6 percent idea versus 40.3 percent starting)
- Industry: Fashion, Technology, or eCommerce
- Brand colors: White paired with black, with green or blue as the accent hue
- Custom icon style: Brush, Ink, or Linocut
- Top product wanted: A website, followed by brand guidelines and social media content
- Most typed slogan word: Style (1,214 occurrences across slogan generations)
- Most typed business name word: Solutions (113 occurrences across logos created)
- What they build next: A custom domain, then a brand kit, then a one page website
Compared to the Q4 2025 composite, the dominant founder still looks like a brand new business owner in the earliest stage of their journey. Brush replaced Playful as the most generated custom icon style. Solutions and Apex moved into the top three business name words, pushing out Cooking, ASMR, and Gaming from Q4. Inspirational replaced Fun as the most picked slogan tone when founders attached one. Future quarterly reports will track how this composite continues to shift.
Who Is Starting a Business
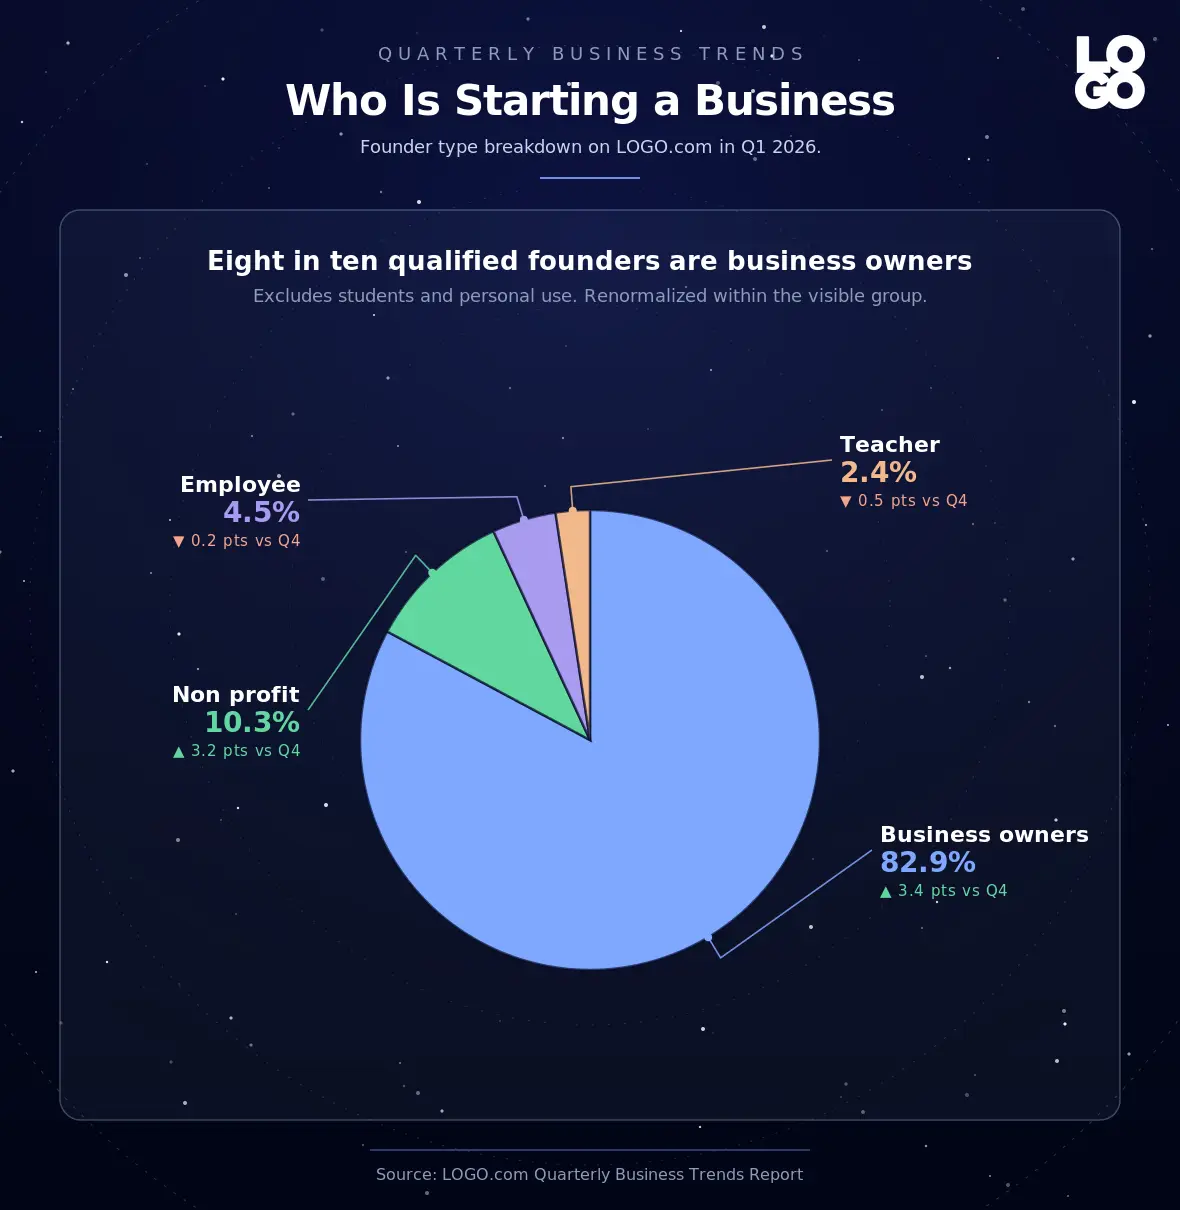
When new LOGO.com users describe themselves at sign up, two thirds self identify as business owners (66.9 percent of the four category mix that excludes students and personal use), with the remaining third split across non profit founders (8.3 percent of the same mix), employees launching side projects (3.6 percent), and teachers building school or community businesses (1.9 percent). Renormalized to the visible group, business owners actually account for 82.9 percent of all qualified founders this quarter.
The Q4 2025 mix looked different with business owner being roughly 79.5 percent of the qualified pool, with non profit at 7.1 percent, employee at 4.7 percent, and teacher at 2.9 percent.
The reading: the qualified founder pool tilted slightly further toward business owners between quarters, with non profits gaining and the employee and teacher slices easing back. Non profit growth in particular is worth flagging. One in nine qualified founders in Q1 2026 is starting a non profit, up from roughly one in fourteen in Q4 2025, a notable two quarter trend in mission driven brand creation.
What Stage Founders Are At
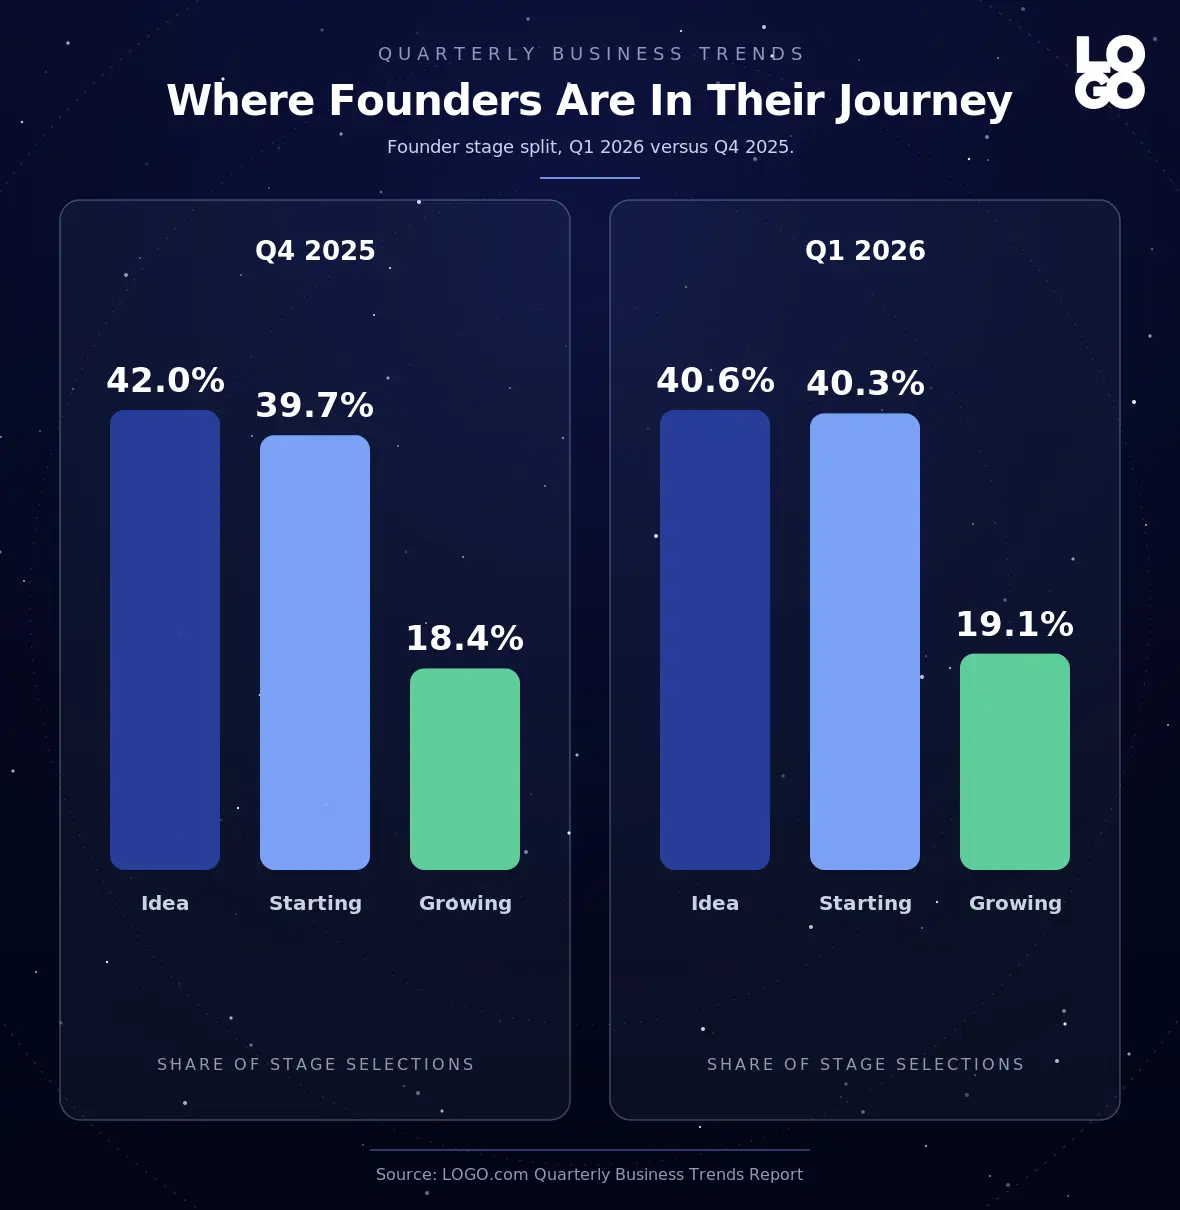
According to LOGO.com data, the business stage breakdown across 944,189 stage selections in Q1 2026 splits almost evenly between two leading groups. Founders with just an idea make up 40.6 percent of stage selections, founders actively starting a business make up 40.3 percent, and founders growing an existing business make up 19.1 percent.
Q4 2025 looked nearly identical. Across 1,232,058 stage selections last quarter, Idea was 42.0 percent, Starting was 39.7 percent, and Growing was 18.4 percent. The shifts are small but directionally meaningful. Idea stage slipped 1.4 points. Starting stage gained 0.6 points. Growing stage gained 0.7 points. Founders are creeping a step further along the journey on average. The audience is not radically different, but the share who are already actively building is widening.
The takeaway for product teams is that more than four in five founders on LOGO.com this quarter are at the idea or starting stage. Tools that compress the time between brand creation and first published asset matter most to this audience.
Most Popular Industries in 2026
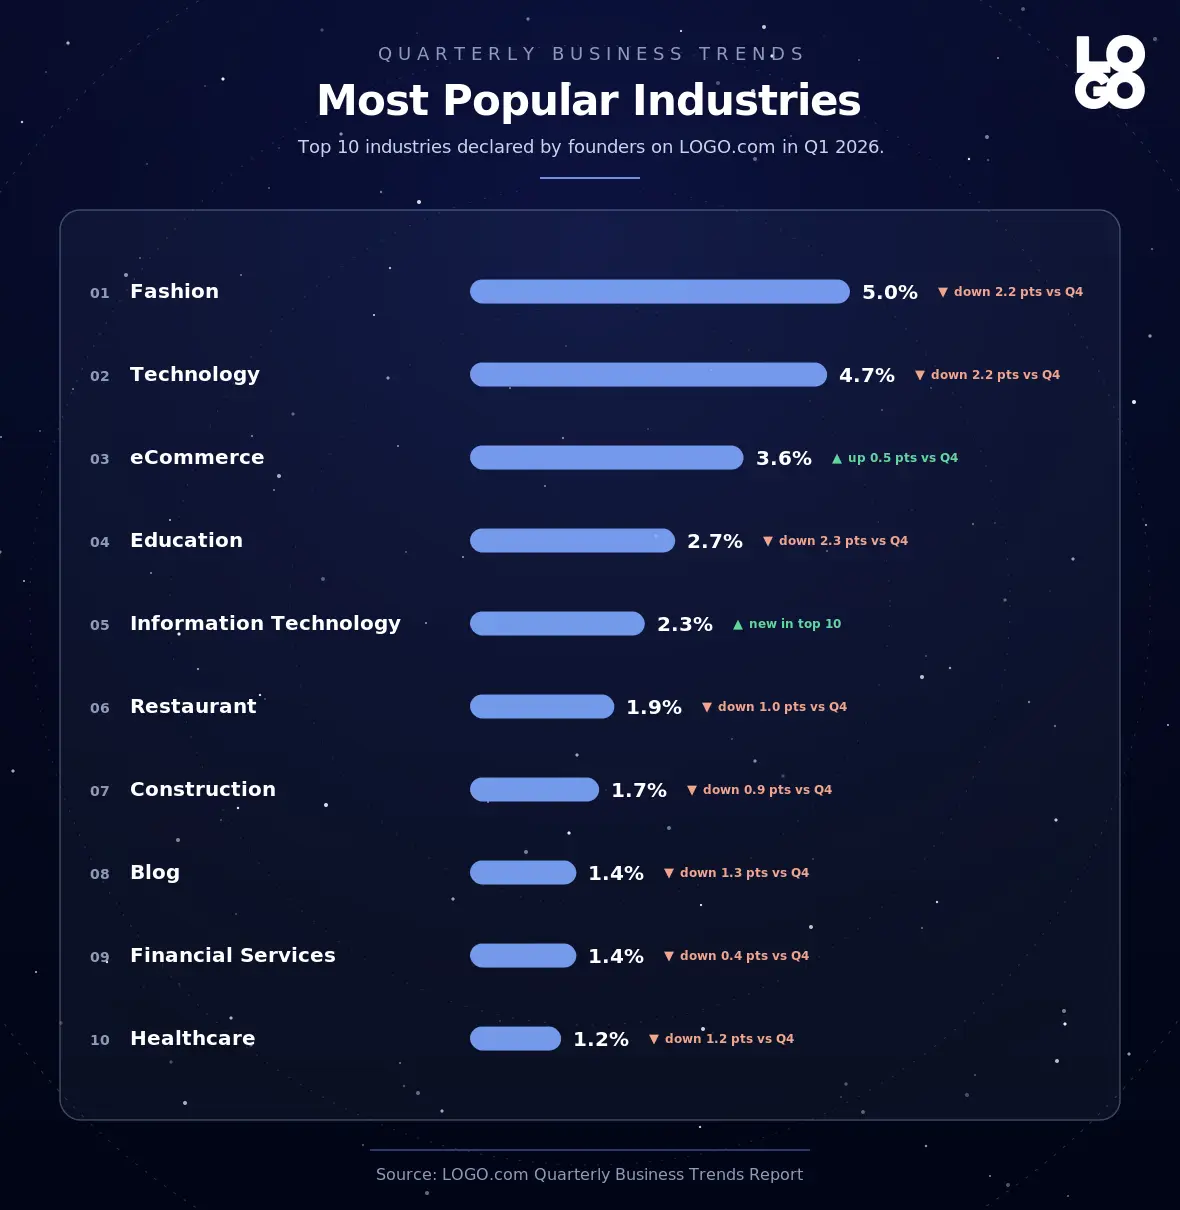
Fashion led the field this quarter at 5.0 percent of new brands, edging ahead of Technology at 4.7 percent to take the number one spot. eCommerce came in third at 3.6 percent, followed by Education at 2.7 percent and Information Technology at 2.3 percent. Restaurant (1.9 percent), Construction (1.7 percent), Blog (1.4 percent), Financial Services (1.4 percent), and Healthcare (1.2 percent) round out the top 10.
Compared to Q4 2025, the leaderboard is structurally similar but the gap between the biggest categories is tighter. In Q4, Fashion was 7.2 percent and Technology was 6.9 percent, so the two leaders held a wider share of the founder pool. Education was 5.0 percent in Q4 and slipped to 2.7 percent in Q1. eCommerce climbed from 3.1 percent to 3.6 percent and overtook Education for the third spot.
What stood out in Q1 2026 that did not stand out in Q4: Information Technology emerged as the fifth largest declared industry at 2.3 percent, climbing several places into the top five for the first time. Restaurant and Construction held steady year on year as the top tier of physical, location based industries. Real Estate slipped out of the top 10 in Q1 after sitting tenth in Q4. Together with Real Estate falling and Information Technology rising, the founder mix tilted further toward digital first categories.
Just outside the top 10 on the watch list, Real Estate sits at 1.2 percent, Artificial Intelligence at 0.9 percent, Health and Wellness at 0.8 percent, and Automotive at 0.8 percent. AI is worth flagging on its own. A year ago the category barely registered as a self declared industry. In Q1 2026 it ranks 14th overall and is on a trajectory to enter the top 10 within two quarters.
The combined share of Fashion, Technology, eCommerce, and Information Technology in Q1 2026 is roughly 15 percent of all new brands. In Q4 2025 those four categories combined to roughly 18 percent, a quieter tightening that points to a more diverse long tail of niche industries entering the platform this quarter.
Most Popular Brand Colors in 2026
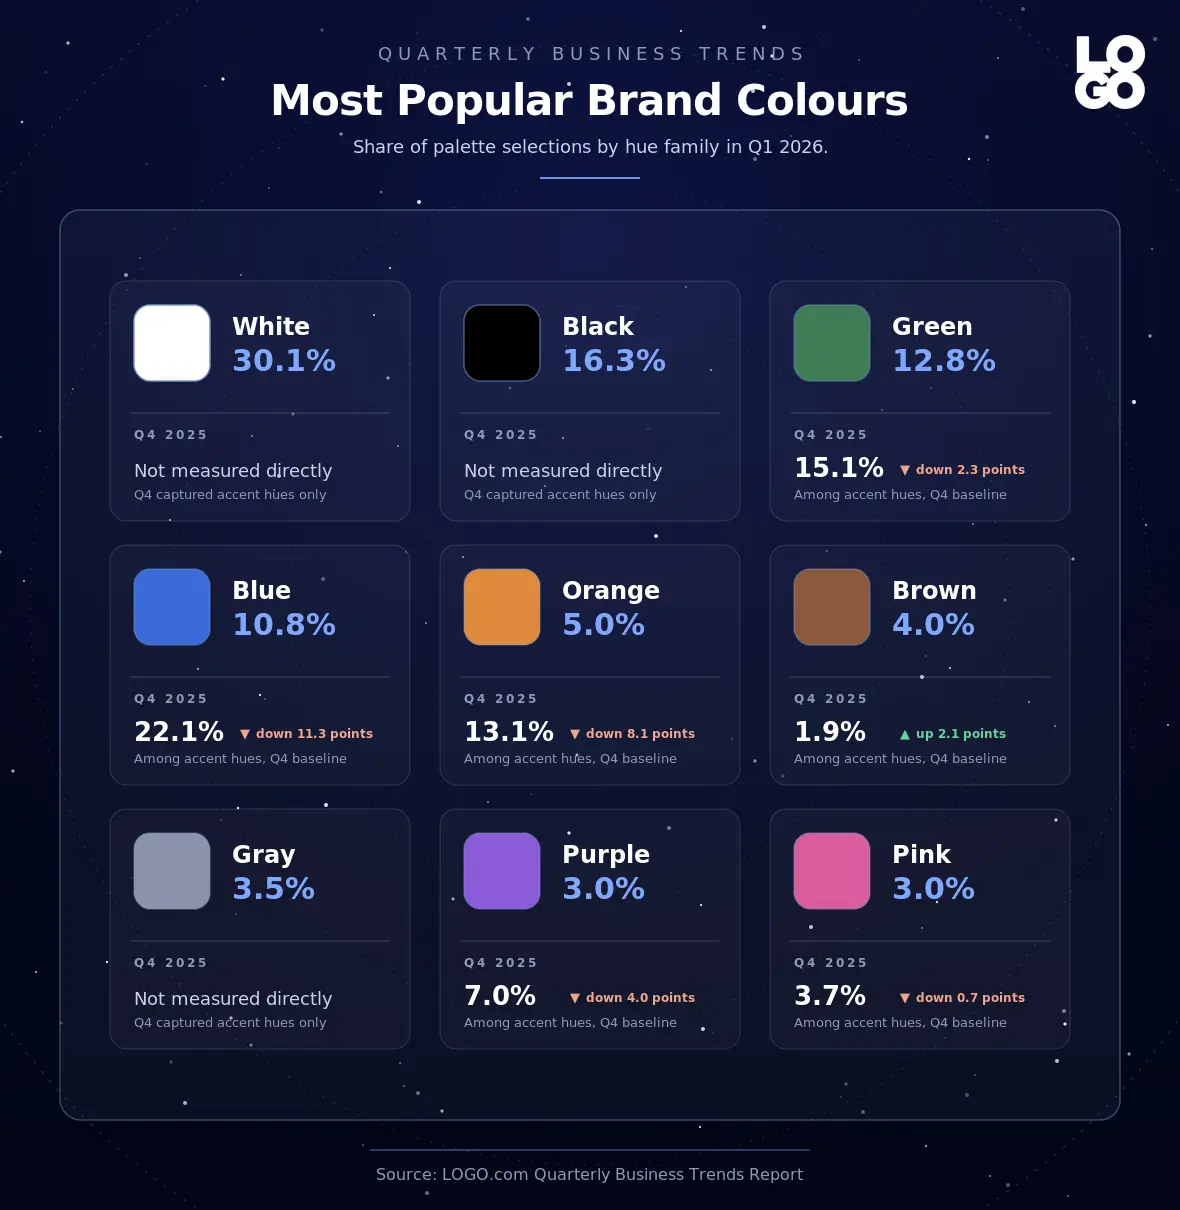
According to LOGO.com data, the share of palette selections by hue family in Q1 2026 (562,742 palette selections in total) is led by white at 30.1 percent, followed by black at 16.3 percent. Green is the most popular non neutral hue at 12.8 percent, ahead of blue at 10.8 percent. Orange (5.0 percent), brown (4.0 percent), gray (3.5 percent), purple (3.0 percent), and pink (3.0 percent) round out the top 9 in the image. Yellow (2.7 percent) and red (2.7 percent) sit just outside the top 9.
White and black anchor more than 46 percent of all palette selections in Q1 2026, reinforcing that neutrals remain the load bearing color choice for cross format flexibility. Among non neutrals, the Q1 2026 leaderboard is Green, then Blue, then Orange, then Brown.
Q4 2025 used a different methodology for hue classification because the dedicated palette hue property only began emitting reliable values in Q1 2026. For Q4 we derived the dominant non neutral hue from the accent color of each palette, which produced a different distribution: Red led at 23.3 percent of non neutral accents, Blue at 22.1 percent, Green at 15.1 percent, Orange at 13.1 percent, Teal at 8.1 percent, Purple at 7.0 percent, Yellow at 5.5 percent, Pink at 3.7 percent, and Brown at 1.9 percent. Read carefully, the comparable pattern is that Green ranked third in Q4 and second in Q1, while Blue slipped from a clear second to fourth. Red, which led the Q4 derived accent ranking, is far less prominent when measured by direct palette hue in Q1 2026, suggesting that founders use red as an accent more often than as the dominant brand color.
The clearest two quarter trend is that Green continues to gain on Blue as the dominant non neutral brand color, mirroring the heavier mix of Health and Wellness, Education, and Restaurant brands launching on the platform. Orange remains the dominant warm accent, edging out brown, gray, and the bright reds and yellows traditionally associated with food and energy brands.
Most Popular Logo Fonts in 2026
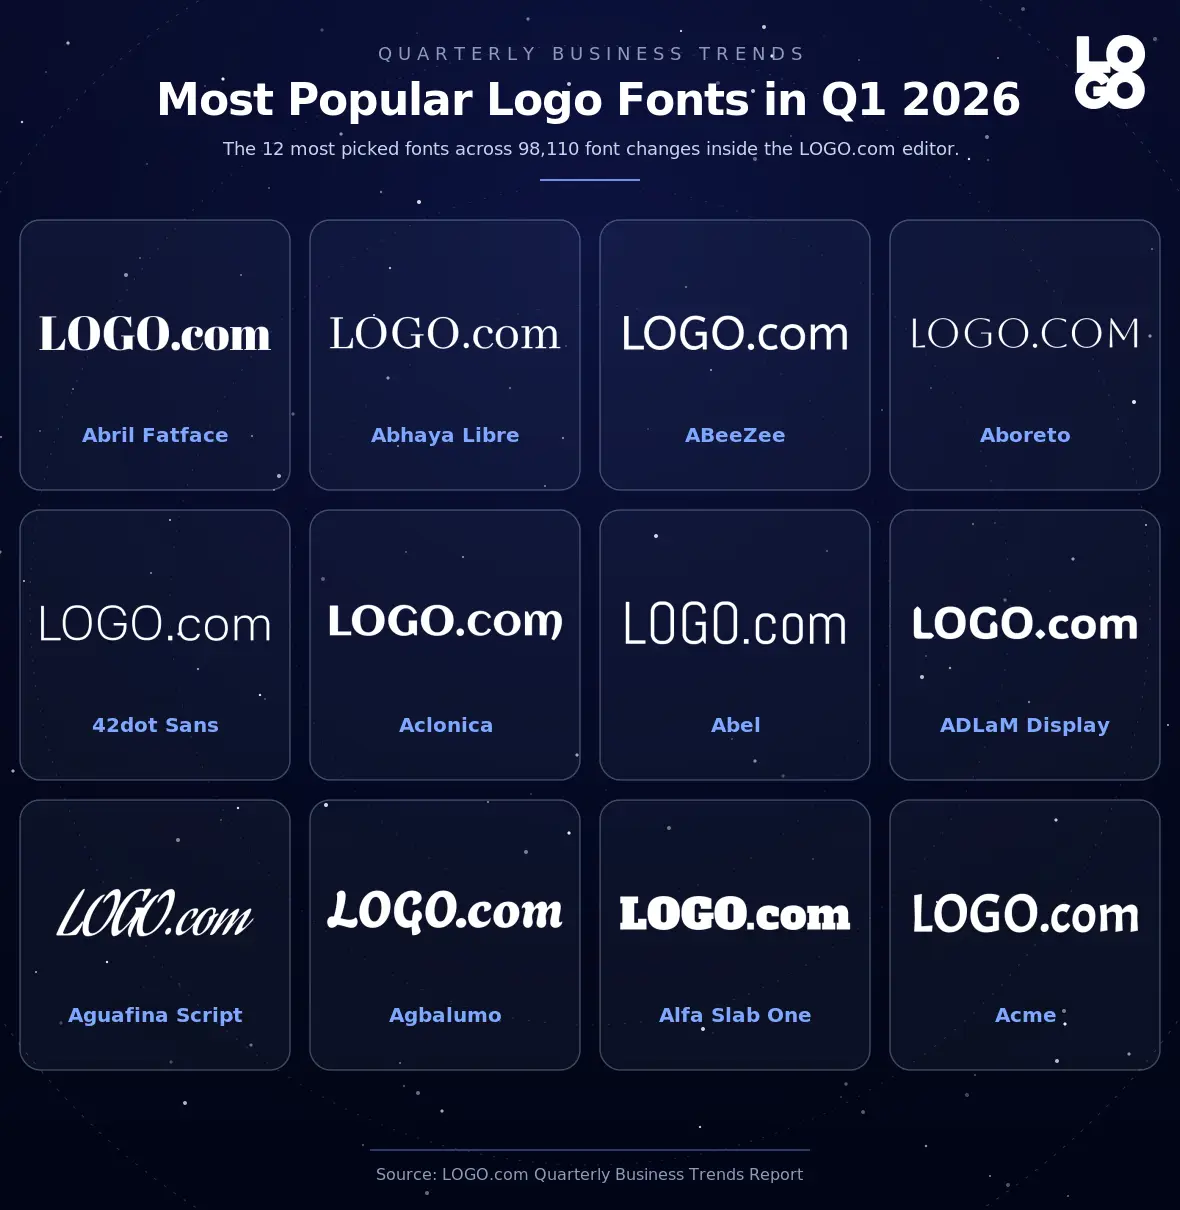
Across 98,110 font changes inside the LOGO.com editor in Q1 2026, founders gravitated to display oriented serif, geometric sans, and script fonts. The 12 most actively selected fonts were Abril Fatface (3.0 percent of font changes), Abhaya Libre (2.1 percent), ABeeZee (2.1 percent), Aboreto (2.0 percent), 42dot Sans (2.0 percent), Aclonica (1.9 percent), Abel (1.4 percent), ADLaM Display (1.3 percent), Aguafina Script (1.3 percent), Agbalumo (1.2 percent), Alfa Slab One (1.0 percent), and Acme (1.0 percent).
Compared to Q4 2025, the top of the leaderboard is remarkably stable. Abril Fatface held its number one position at exactly 3.0 percent of font changes in both quarters. ABeeZee held a top three slot. ADLaM Display, Aguafina Script, Agbalumo, and Abhaya Libre all stayed inside the top 10. The biggest mover was Aclonica, which was the second most picked font in Q4 at 2.3 percent and slipped to sixth at 1.9 percent in Q1. Abyssinica SIL was inside the Q4 top 10 but slipped out of the Q1 top 12, while Aboreto, 42dot Sans, and Abel climbed into the Q1 top 10 from outside the Q4 top 10. Alfa Slab One and Acme both held positions in the Q4 top 10 and now sit at the bottom of the Q1 top 12, suggesting the heaviest slab serifs are losing share but not disappearing.
The Q4 to Q1 picture suggests founders are gradually trading some of the heaviest slab serif looks for lighter geometric and modern serif faces. Aboreto and 42dot Sans entering the top 10 are the clearest examples. Alfa Slab One slipping from a Q4 top 10 slot to position 11 in Q1 is the inverse signal of the same shift.
The top selections still lean heavily display and decorative across both quarters, indicating that founders pick distinctive fonts for the logo mark itself rather than safer body fonts. Classic body workhorses like Open Sans, Inter, Roboto, Montserrat, Playfair Display, and Lora remain heavily used once founders move into brand kits and websites, but none of them break into the top 10 most decisively selected fonts at the logo stage in either quarter.
The takeaway for designers is that founders make their decisive font choice based on visual personality. Pair a distinctive display face for the logo with a more neutral system font for the website and emails.
How Many Icons Founders Tried Per Logo
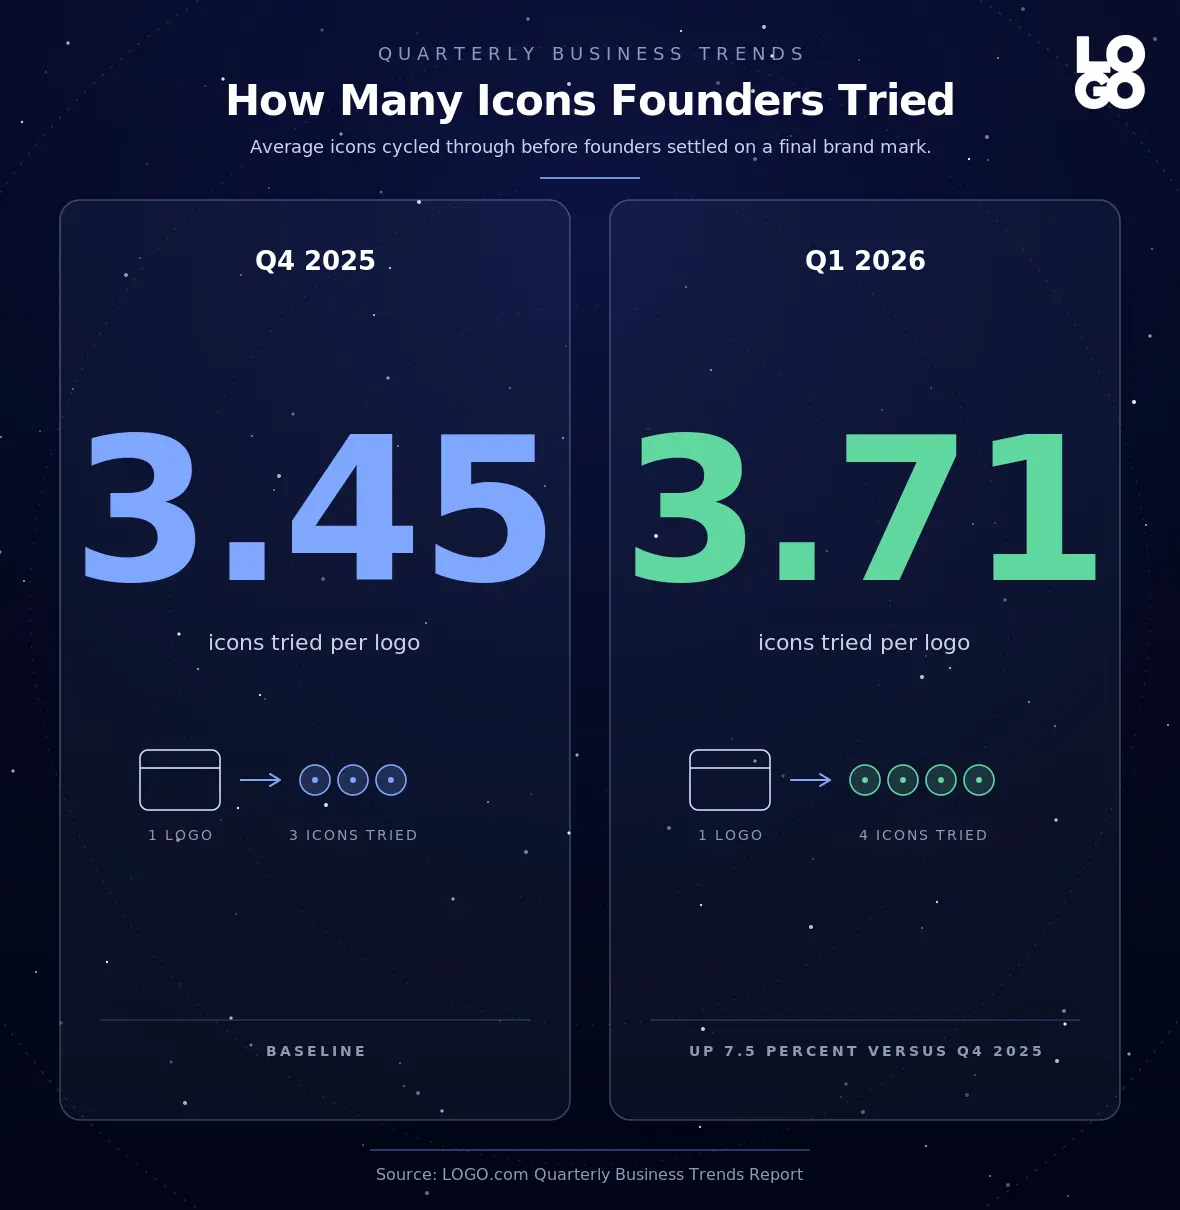
LOGO.com lets founders cycle through different icon options while building their logo, swapping symbols in and out until one feels right. The cleanest first party signal for how much exploration goes into picking an icon is the average number of icons each founder tested before settling on the final brand mark.
In Q1 2026 founders tested an average of 3.71 icons per logo (606,858 icon swaps across 163,414 logos created). In Q4 2025 the same average was 3.45 (691,379 icon swaps across 200,242 logos). Founders explored roughly 7.5 percent more icons per logo this quarter than last.
That uplift matters because it lines up with the surge in custom icon generations covered in the next section. Founders did not just attach more icons to their logos, they spent more steps choosing and refining icons within the editor. The brand mark, not the wordmark, is taking a bigger share of attention quarter over quarter.
A reasonable interpretation: with Brush, Ink, and Linocut emerging as the new dominant custom icon styles in Q1, founders are not satisfied with the first option they see and are testing more variations before committing. The platform is benefiting from a more deliberate icon selection moment in the brand creation flow.
Most Popular Custom Icon Styles in Q1 2026
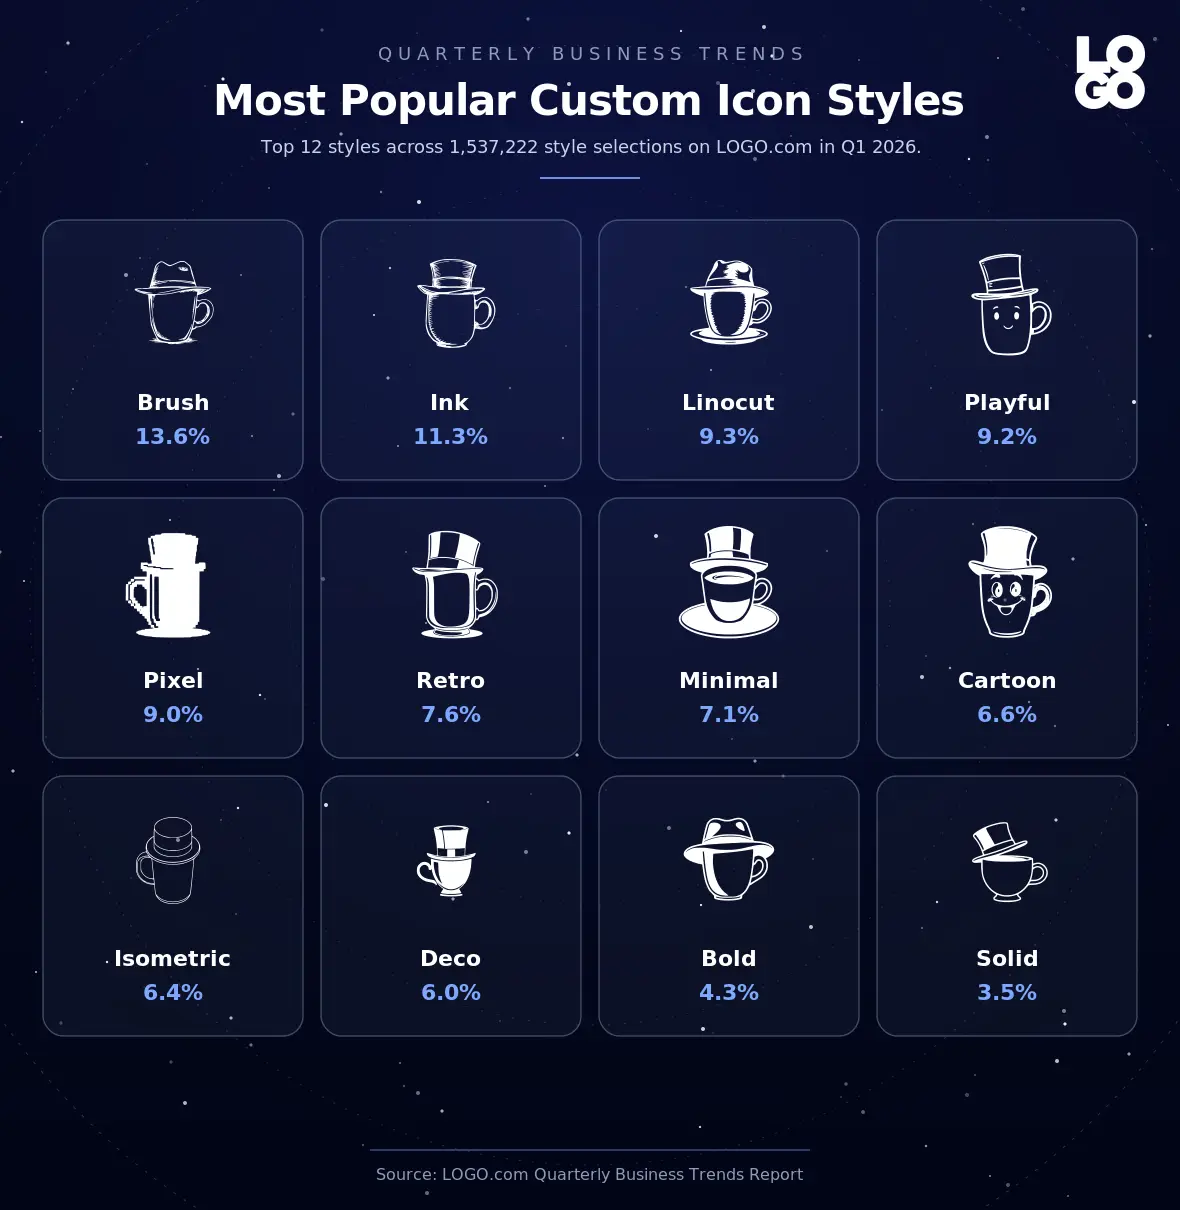
This quarter founders generated 412,801 custom icons and made 1,537,222 style selections across the custom icon flow. The top styles were Brush (209,157 selections), Ink (173,229), Linocut (142,245), Playful (141,677), Pixel (138,824), Retro (117,463), Minimal (109,301), Cartoon (101,213), Isometric (97,829), Deco (92,280), Bold (65,938), and Solid (53,603).
In Q4 2025, when founders had to pick a single style attribution per generation, the order looked very different. Playful was overwhelmingly the most engaged style, attached to 82.4 percent of 90,197 generations, followed by Linocut (74.1 percent), Retro (62.5 percent), Cartoon (50.4 percent), Illustration (45.4 percent), and Minimal (33.1 percent).
The Q1 2026 introduction of Brush and Ink, styles that produce hand drawn organic icon marks is the single biggest shift in the entire report. Together they account for nearly 25 percent of all single style attribution this quarter. Linocut held its top three position. Playful slipped from the runaway leader to fourth. The composition of new brand marks is moving away from polished playful illustration and toward textured hand drawn marks that read as more authentic and editorial.
Minimal sits in seventh place in Q1 2026, climbing relative to its Q4 share. The long running minimalist logo trend narrative is more nuanced than the design press makes it. When founders are given the choice, the majority pick textured, illustrative, or playful styles over flat geometric minimalism. Most logo trend content online still leads with minimalism. Our first party data shows the opposite is happening in 2026.
What Founders Are Describing for Custom Icons
According to LOGO.com data, the most common themes inside custom icon descriptions in Q1 2026 are heavily industry led. Across the top 20 themes pulled from custom icon descriptions, Fashion leads at 10.2 percent, followed by Clothing (8.4 percent), Style (7.7 percent), Technology (7.1 percent), Construction (6.4 percent), Building (5.7 percent), Food (5.7 percent), Music (4.8 percent), Home (4.8 percent), and Health (4.8 percent). Car, Education, Finance, Beauty, Apparel, Design, Growth, Restaurant, Learning, and Cleaning round out the top 20.
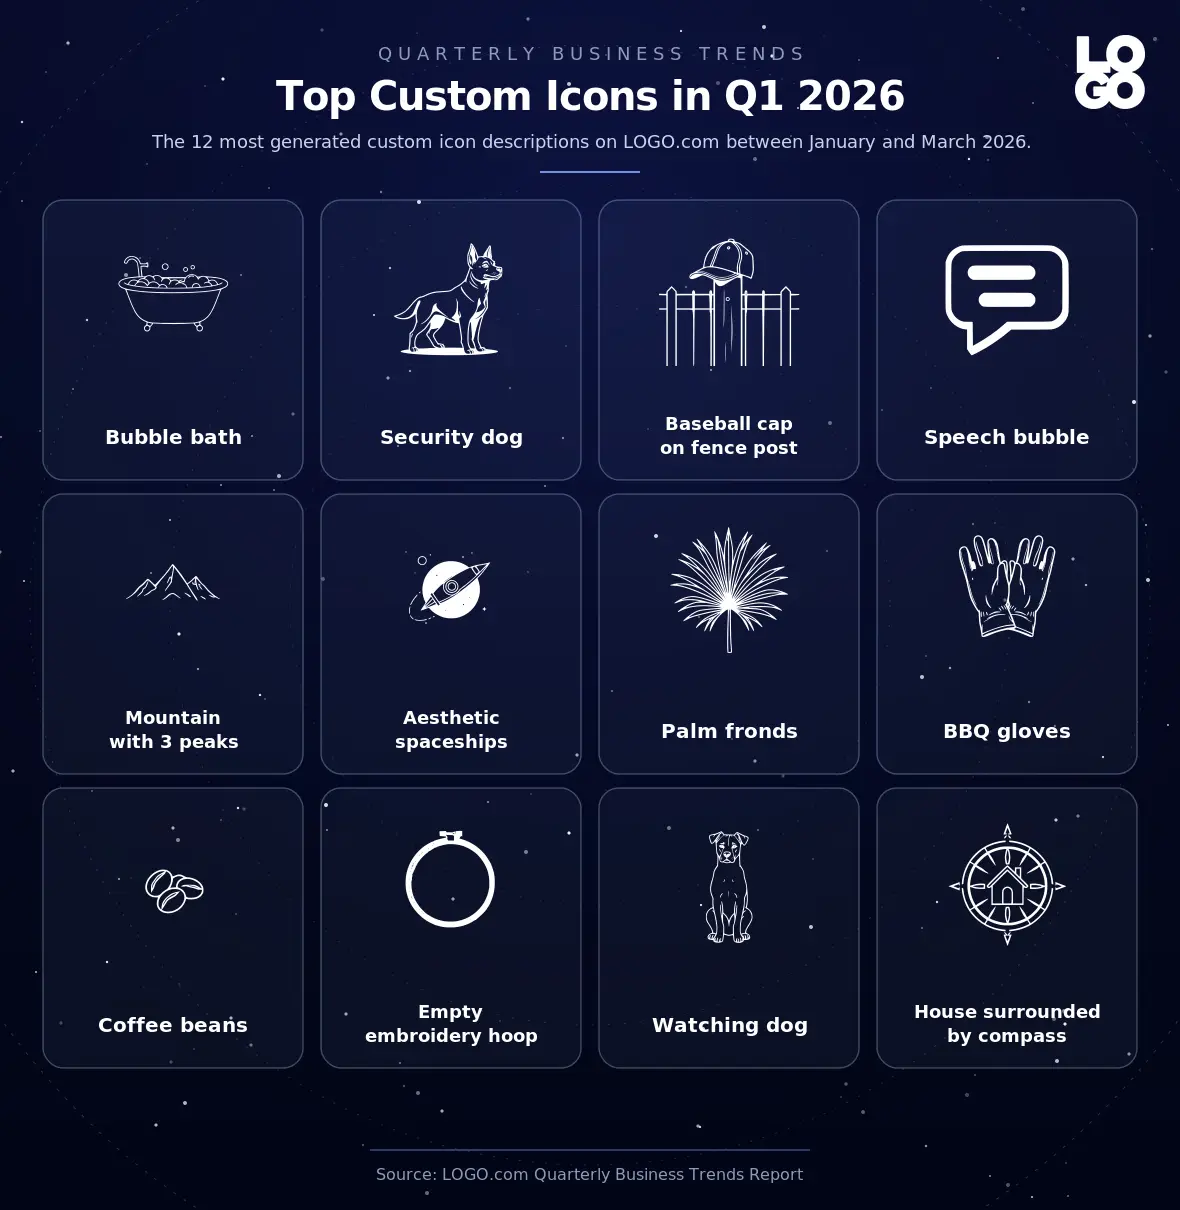
The top single object descriptions in Q1 2026 (looking only at the highest count multi word descriptions) were Bubble bath, Security dog, Baseball cap on fence post, Speech bubble, Mountain with three peaks, Aesthetic spaceships, Palm fronds, BBQ gloves, Coffee beans, Empty embroidery hoop, Watching dog, and House surrounded by compass.
The Q1 2026 list reflects a wider range of niche specific descriptions than the Q4 2025 corpus, where the volume of generations was roughly four times smaller and concentrated around generic industry shorthand. Unlike other logo makers that rely on stock icons, our custom icons generator allows business owners to have truly unique logos by creating their own custom icons that no stock library has.
Most Popular Business Name Words in Q1 2026
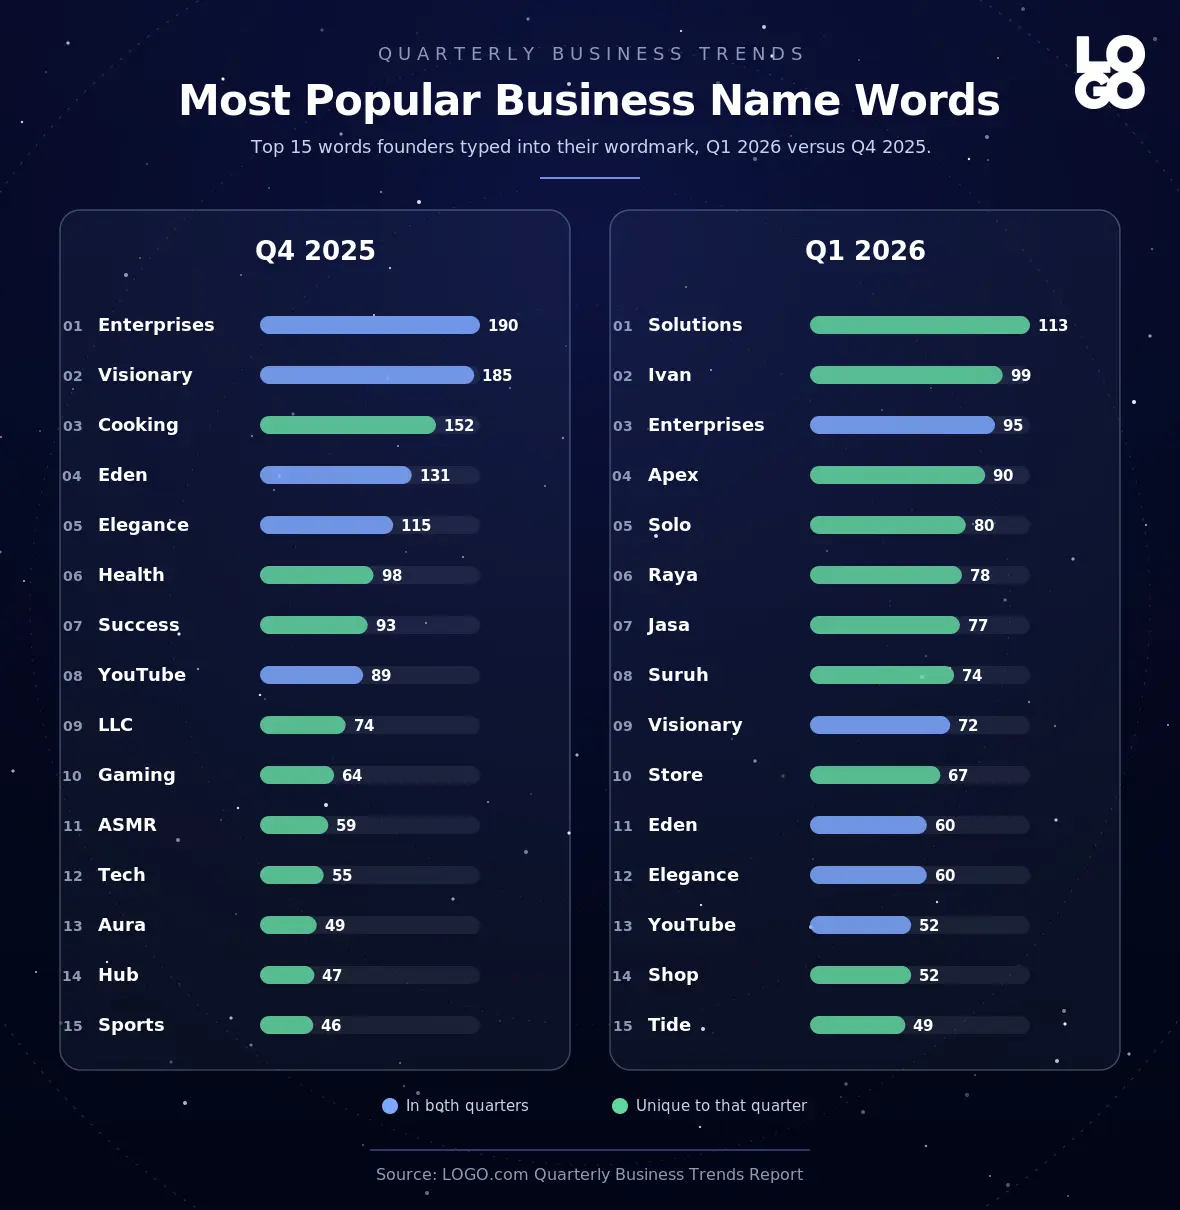
When founders type their brand name into the LOGO.com editor in Q1 2026, the most repeated word across the top of the wordmark distribution is Solutions (113 occurrences), followed by Ivan (99), Enterprises (95), Apex (90), Solo (80), Raya (78), Jasa (77), Suruh (74), Visionary (72), Store (67), Eden (60), Elegance (60), YouTube (52), Shop (52), and Tide (49). After dropping placeholder strings, stopwords, and one or two character tokens, these are the actual words founders chose to put on their logo.
The Q4 2025 list looked notably different. Last quarter the most repeated wordmark words were Enterprises (190 occurrences), Visionary (185), Cooking (152), Eden (131), Elegance (115), Health (98), Success (93), YouTube (89), LLC (74), Gaming (64), ASMR (59), Tech (55), Aura (49), Hub (47), and Sports (46).
Five words carry across both quarters in the top 15: Enterprises, Visionary, Eden, Elegance, and YouTube. The story is in what changed. Solutions, Apex, Solo, Store, Shop, and Tide entered the top 15 in Q1 2026. Cooking, Health, Success, LLC, Gaming, ASMR, Tech, Aura, Hub, and Sports all dropped out.
Q4 2025 was dominated by creator economy and lifestyle categories. Cooking, Gaming, ASMR, Health, and Sports were all top fifteen business name words. Q1 2026 swapped those for service and B2B language. Solutions took the number one spot, Apex moved into the top five, and storefront words like Store, Shop, and Tide entered the list as commerce founders flooded onto the platform during the Q1 launch window.
Visionary held its position across both quarters as a top three brand identity word, suggesting it is becoming a default aspirational anchor for new founders. LLC dropping out of the Q1 list is also worth noting. In Q4 founders typed their full legal entity name onto their logo more often. In Q1 the wordmark itself is treated more like a brand name, not a registered entity name.
YouTube ranking in the top 15 of business names across both quarters is the most striking platform driven signal. A small but consistent share of new brands launched on LOGO.com are explicitly building YouTube content businesses, treating the platform as the implicit channel even before the brand exists in the wider economy.
Most Popular Slogan Words in Q1 2026
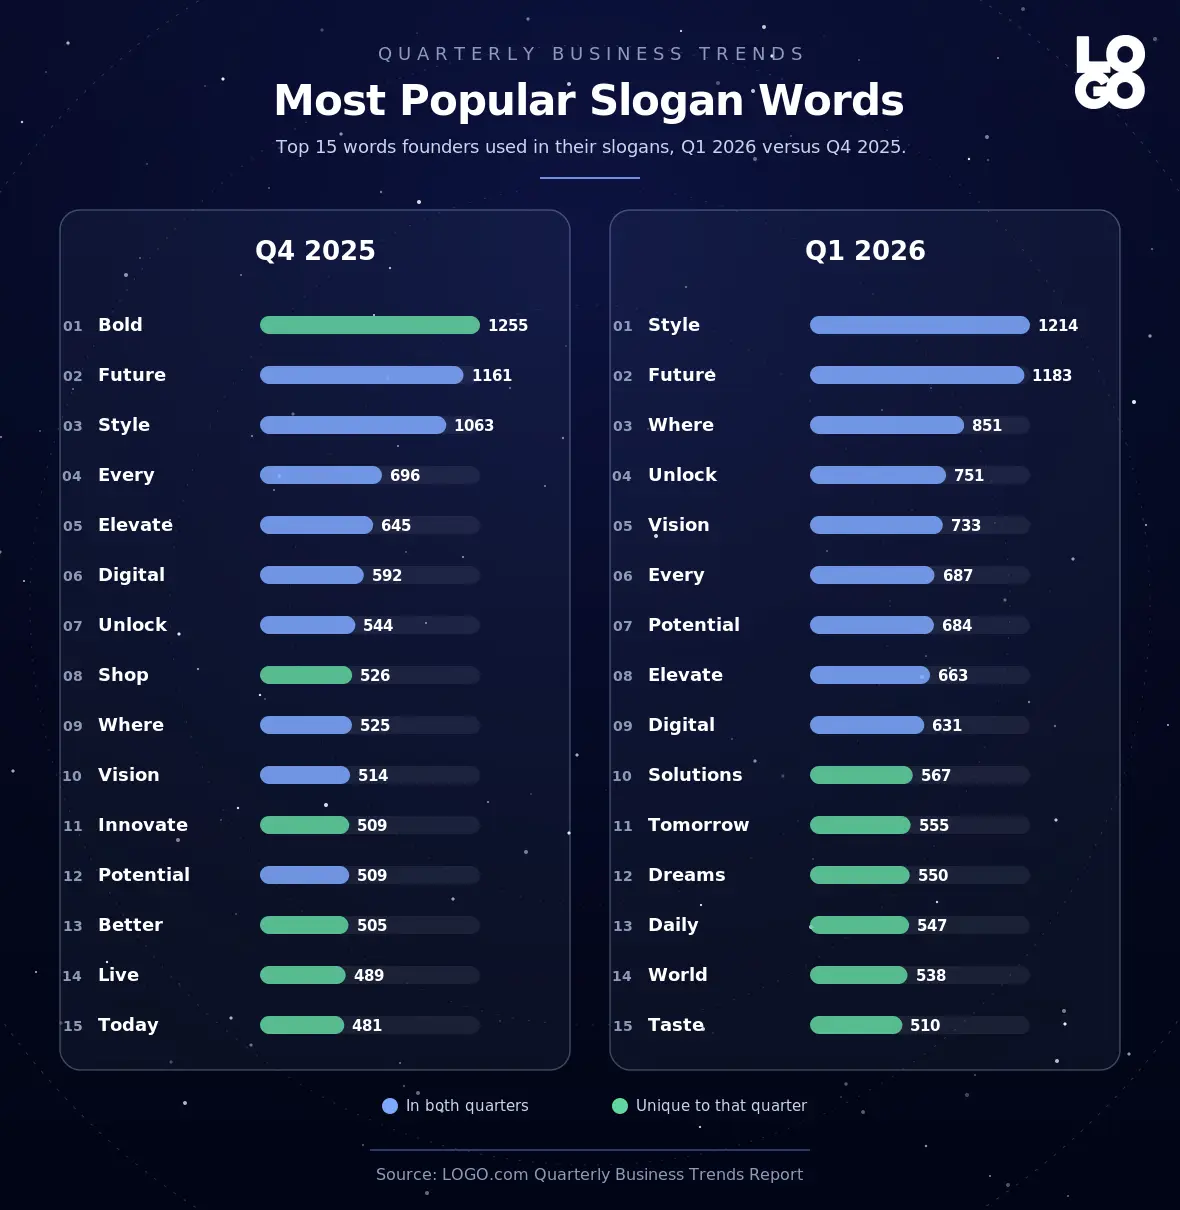
Across 75,191 slogan generations in Q1 2026, the most frequently typed words inside generated slogans were Style (1,214 occurrences), Future (1,183), Where (851), Unlock (751), Vision (733), Every (687), Potential (684), Elevate (663), Digital (631), Solutions (567), Tomorrow (555), Dreams (550), Daily (547), World (538), and Taste (510).
In Q4 2025 the same analysis across 34,660 slogan generations produced Bold (1,255), Future (1,161), Style (1,063), Every (696), Elevate (645), Digital (592), Unlock (544), Shop (526), Where (525), Vision (514), Innovate (509), Potential (509), Better (505), Live (489), and Today (481).
Nine words carry across both quarters in the top 15: Future, Style, Where, Unlock, Vision, Every, Potential, Elevate, and Digital. These are the durable slogan building blocks founders return to regardless of brand category, the canonical "elevate your X" and "unlock your future" cadence.
Q1 2026 added Solutions, Tomorrow, Dreams, Daily, World, and Taste to the top 15. Q4 2025 had Bold, Shop, Innovate, Better, Live, and Today. The Q4 list reads more action oriented and assertive. The Q1 list reads more aspirational and softer, with Dreams and Tomorrow standing out as the new entries. The shift mirrors the same move toward inspirational tone we see in the slogan tone breakdown below.
Two specific words deserve a flag. Bold was the single most typed slogan word in Q4 2025 and fell out of the top 15 in Q1 2026 entirely. That is a meaningful drop for a word that ranked first the prior quarter. And Taste appearing in the Q1 top 15 reflects the stronger restaurant and food brand mix this quarter, since Taste only appears in slogans when founders are explicitly writing for food, beverage, or hospitality categories.
Most Popular Slogan Tones in Q1 2026
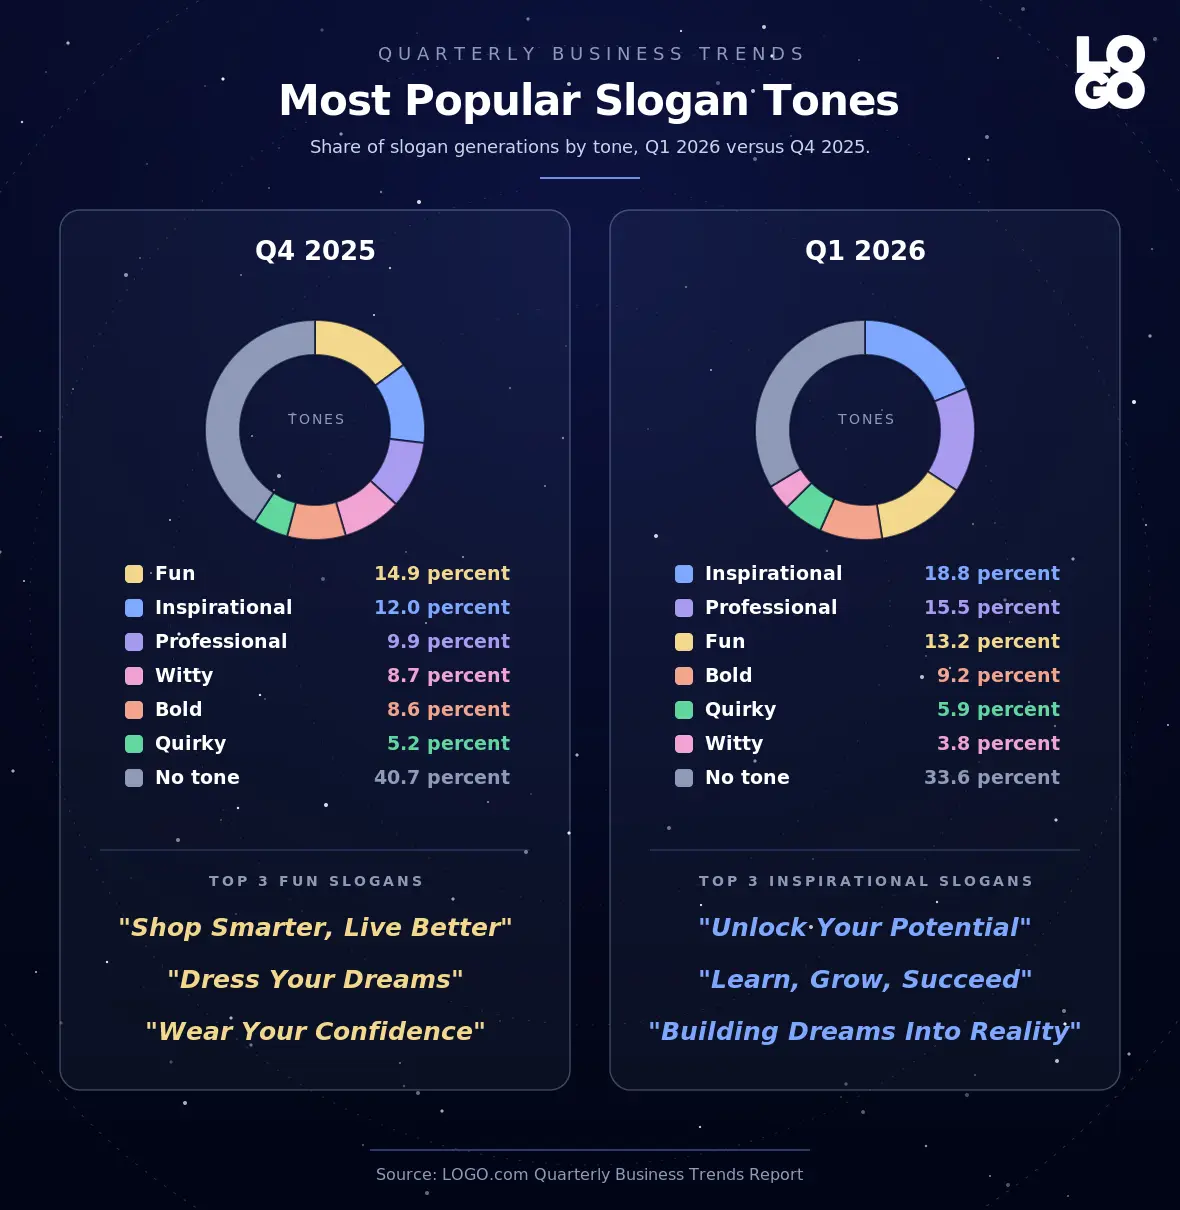
Across 75,191 slogan generations in Q1 2026, when founders specifically picked a tone the most common was inspirational (18.8 percent of tone tagged slogans), followed by professional (15.5 percent), fun (13.2 percent), bold (9.2 percent), quirky (5.9 percent), and witty (3.8 percent). A third (33.6 percent) of tone tagged generations carried no specific tone.
Q4 2025 looked different. When founders picked a tone in Q4, Fun was the most common (14.9 percent), followed by Inspirational (12.0 percent), Professional (9.9 percent), Witty (8.7 percent), Bold (8.6 percent), and Quirky (5.2 percent). The "no tone" share was 40.7 percent in Q4 versus 33.6 percent in Q1, so founders attached a tone tag more often this quarter.
Two shifts stand out. Inspirational jumped from second in Q4 to first in Q1 and grew by nearly seven points. Fun slipped from first to third. The dominant slogan register tilted from Fun toward Inspirational quarter on quarter. Bold and Witty also flipped positions. Bold was below Witty in Q4 and is now above it in Q1, suggesting founders are reaching for slogans that sound more confident and aspirational and pulling back from cleverness for cleverness's sake.
The 75,191 slogan generations in Q1 2026 came from a much smaller pool of brand creators, suggesting that the average founder who uses the slogan tool tests several variations before committing. Witty and Quirky remain niche choices in both quarters, used by a small share of founders confident enough in their brand voice to go off the standard register.
Products Founders & Business Owners Want Most
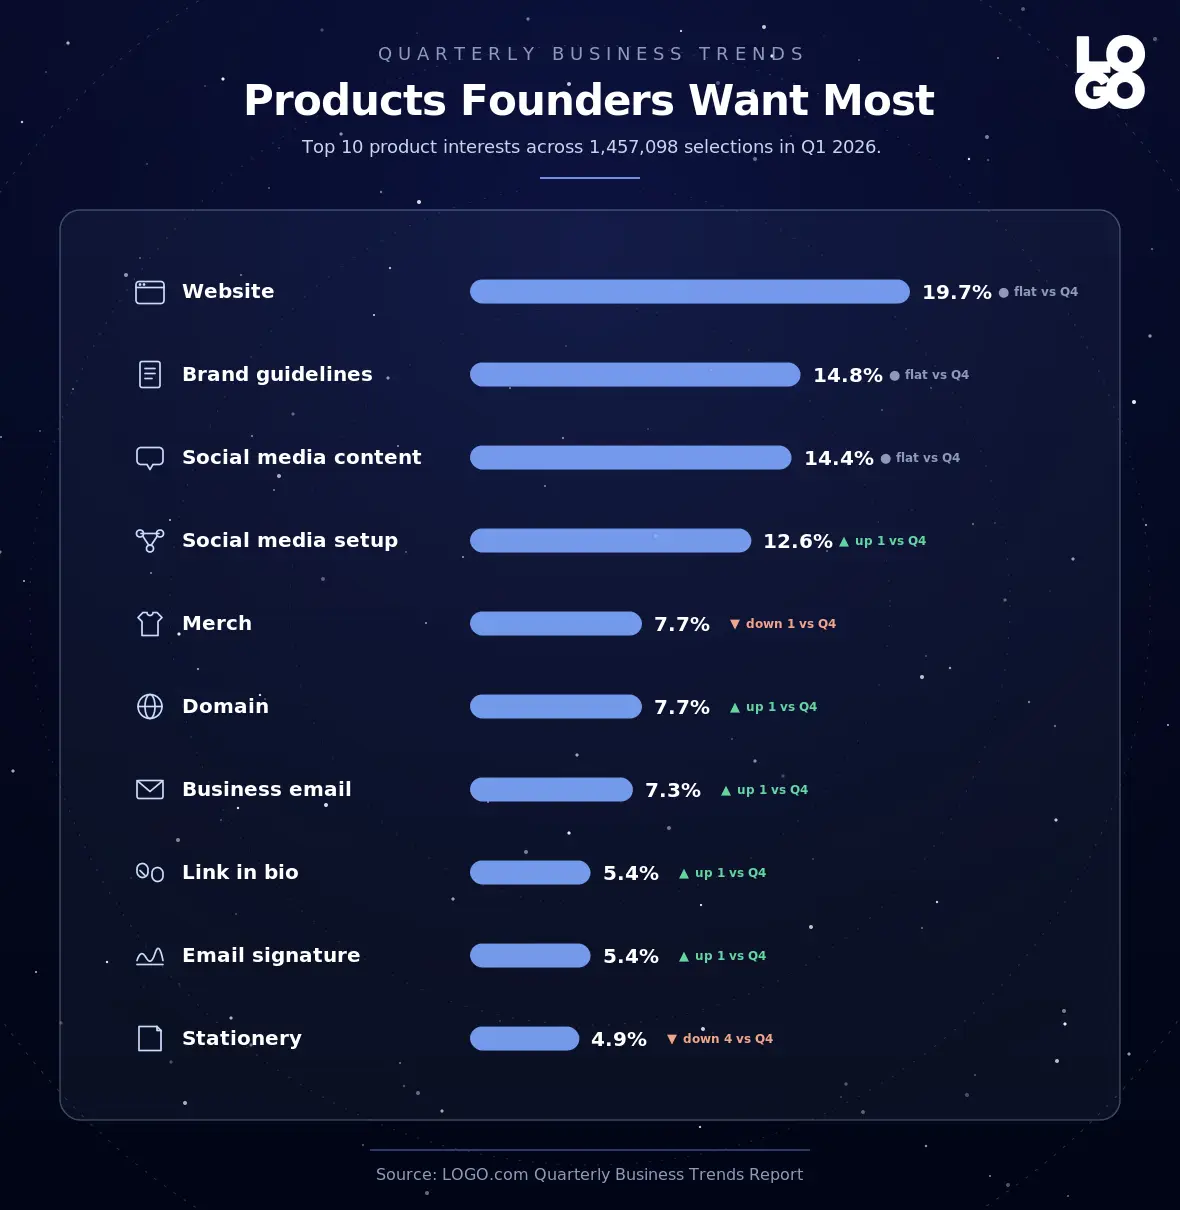
Across 1,457,098 product interest selections in Q1 2026, a website was the single most wanted product after a logo (19.7 percent), followed by brand guidelines (14.8 percent), social media content (14.4 percent), and social media setup (12.6 percent). Combined, these four account for more than 61 percent of all stated product interest this quarter.
After those four, merch and a domain sit roughly tied at around 7.7 percent, business email at 7.3 percent, link in bio and email signature at 5.4 percent each, and stationery rounding out the top 10 at 4.9 percent.
The Q4 2025 ranking by volume was Website (155,893), Brand guidelines (121,095), Social media content (89,429), Merch (63,254), Social media setup (57,725), Stationery (23,966), Domain (21,789), Business email (16,345), Link in bio (15,330), and Email signature (11,696).
Two clear shifts. Social media setup overtook Merch for the fourth spot in Q1 2026, a sign that founders are prioritizing reaching the audience that already exists on social before producing merchandise for it. And Domain rose from seventh in Q4 to a tie for fifth in Q1, mirroring the dominant post logo behavior covered in the next section. Stationery slipped from sixth in Q4 to tenth in Q1, the clearest signal in the data that founders are prioritizing digital first.
What Founders Built After Their Logo
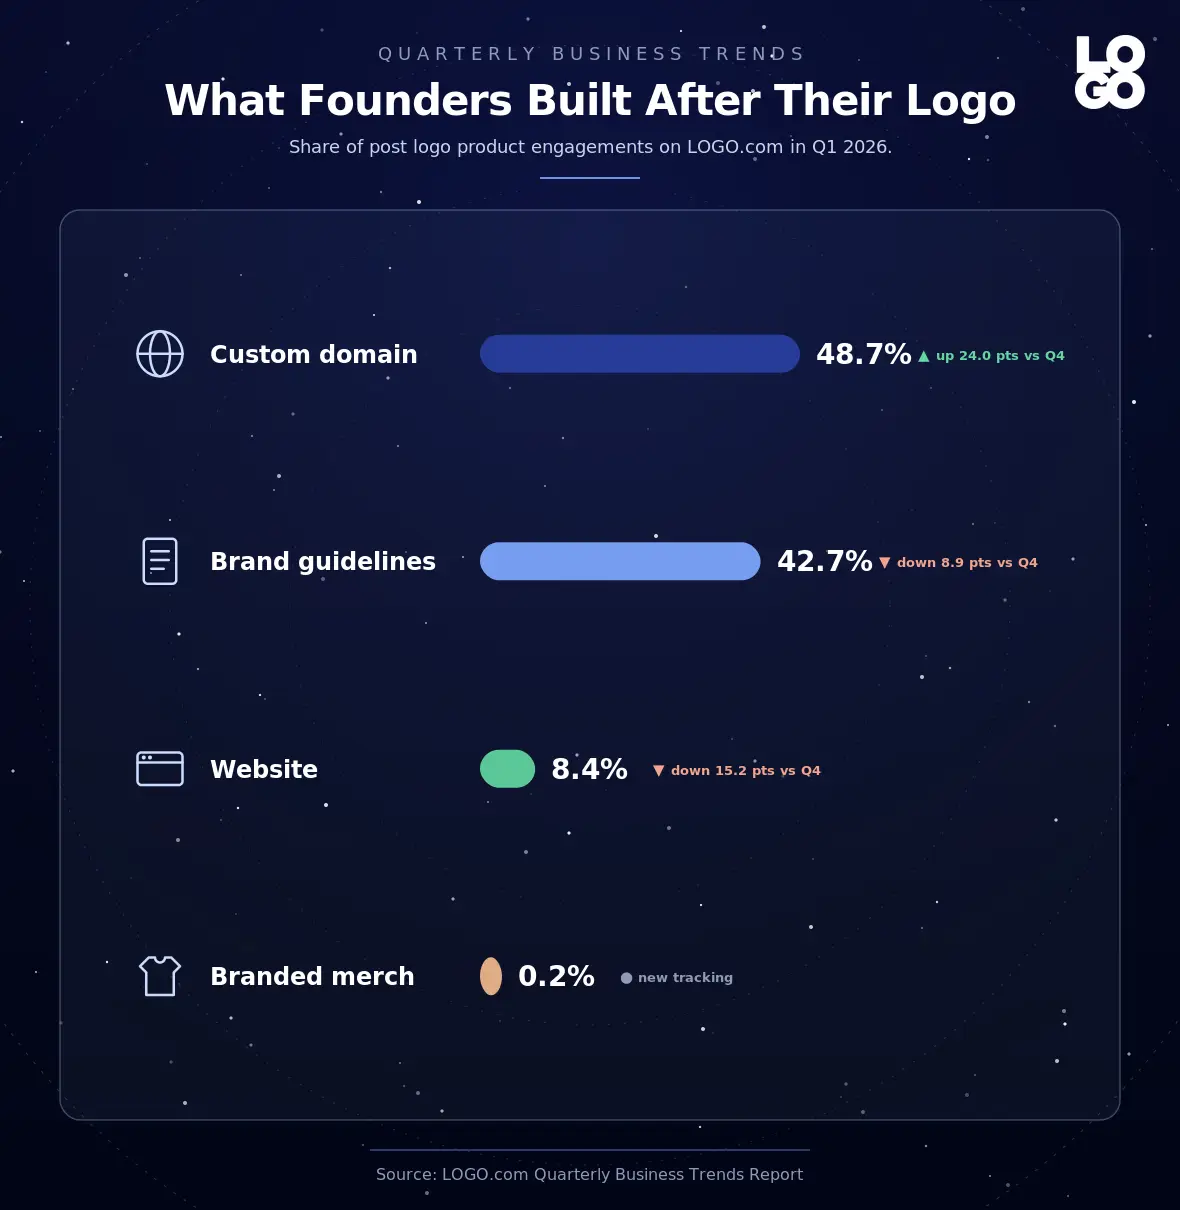
After creating a brand on LOGO.com in Q1 2026, the most engaged next step was claiming a domain (48.7 percent). Clicking into brand guidelines was the second most engaged (42.7 percent), followed by publishing a website (8.4 percent combining one page and Wix publishes) and ordering branded merch (0.2 percent).
Domains are the clear number one next step. Founders are roughly six times more likely to claim a domain than to publish any kind of website in the same quarter, and far more likely to claim a domain than to order branded merch. This is the strongest signal in the data that founders are building digital first identities and locking in their name online before standing up any other touchpoint.
Brand guidelines (the brand kit) is the second most engaged product, capturing more than 42 percent of post logo engagements in Q1 2026. This validates that the brand kit is becoming a real second step in the founder journey, not just a logo accessory.
Most Popular Domain Endings in 2026
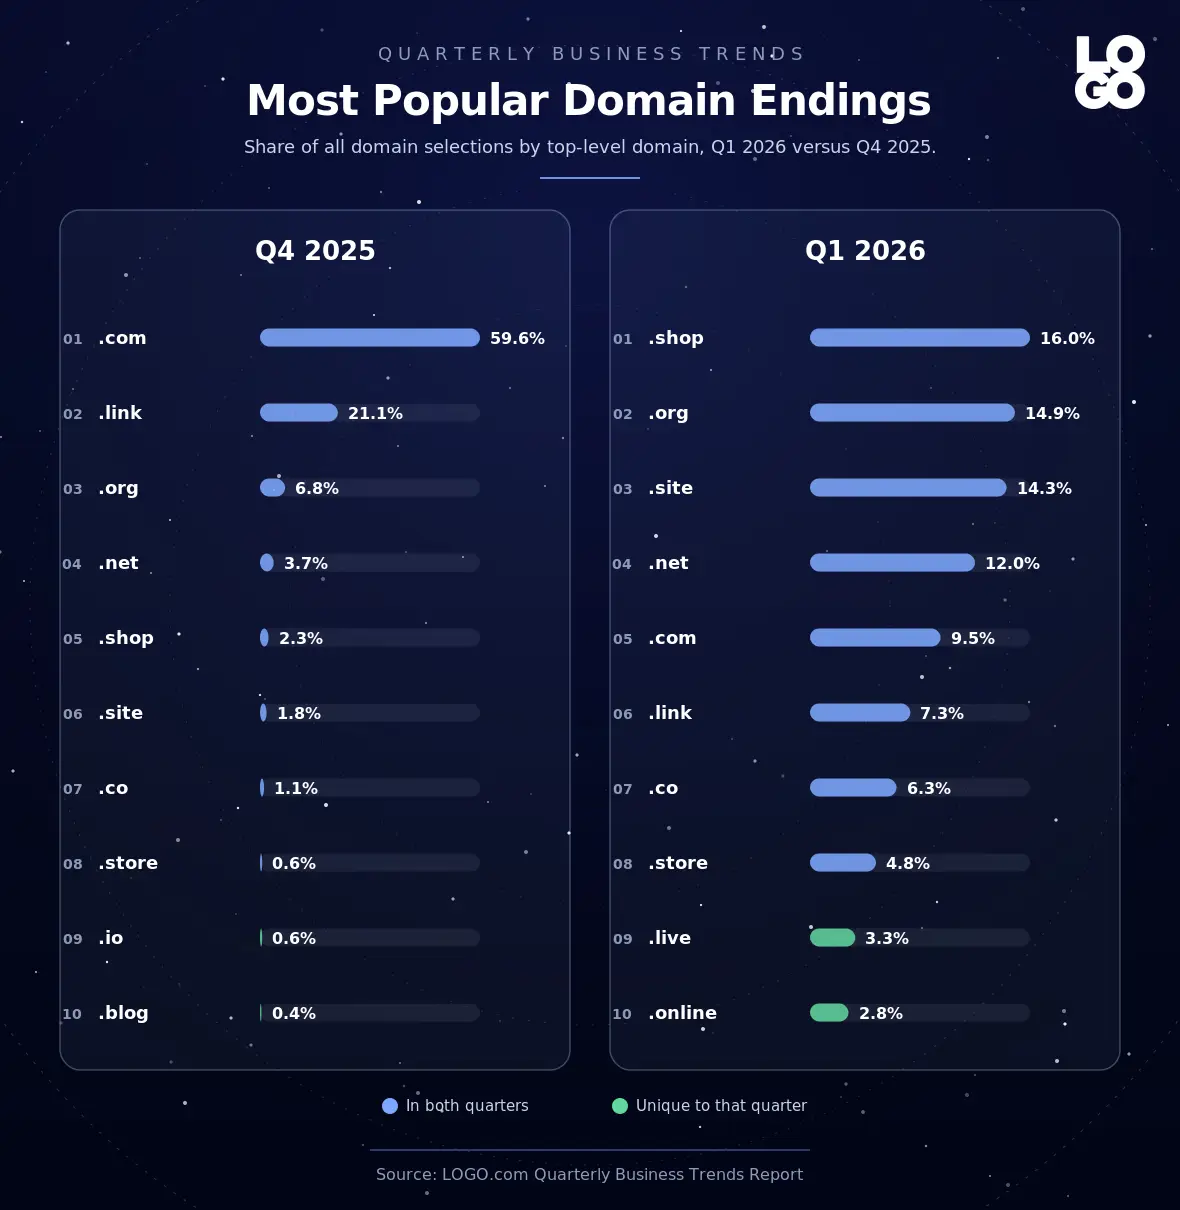
Of all domain selections by founders in Q1 2026, .shop was the most picked TLD at 16.0 percent of selections, ahead of .org (14.9 percent), .site (14.3 percent), .net (12.0 percent), and .com (9.5 percent). .link (7.3 percent), .co (6.3 percent), .store (4.8 percent), .live (3.3 percent), .online (2.8 percent), .io (2.8 percent), and .blog (2.3 percent) round out the top 12.
Q4 2025 looked very different. Last quarter, .com led decisively at 59.6 percent, followed by .link (21.1 percent), .org (6.8 percent), .net (3.7 percent), .shop (2.3 percent), .site (1.8 percent), .co (1.1 percent), .store (0.6 percent), .io (0.6 percent), and .blog (0.4 percent).
This is one of the most significant shifts of Q1 2026. The Q4 2025 selection mix was very small and dominated by .com. In Q1 2026 the selection volume is meaningfully larger and shows commerce focused TLDs taking the lead. .shop, .site, .store, and .online combined account for nearly 38 percent of all Q1 selections, up from just 4.7 percent of Q4 selections. Some of the shift reflects a tracking expansion in Q1 that captured more long tail TLD picks, but the directional movement, .com share falling steeply and purpose built commerce TLDs rising, is consistent with what founders told us in the slogan and business name data above. Founders are choosing TLDs that signal exactly what their business does rather than fighting for an unavailable .com.
Among LOGO.com founders, .com placed fifth in Q1 2026 at less than 10 percent of selections. This is a meaningful shift in how new founders think about domains.
Q2 2026 Predictions
Five predictions for Q2 2026, each tied directly to a Q1 2026 findings and data.
- Brush will overtake Linocut as the second most generated custom icon style behind Ink, with Ink in turn closing on Brush for the top spot. Brush and Ink together already account for nearly 25 percent of single style attribution in Q1 and they are still climbing.
- Green will widen its lead over Blue as the dominant non neutral brand color. Green is already ahead at 12.8 percent versus blue at 10.8 percent of palette selections, and the underlying mix of Health and Wellness, Restaurant, and Education brands is rising.
- Inspirational will keep growing as the dominant slogan tone, with Bold reclaiming the second slot from Professional as founders gravitate toward more confident registers. The Q4 to Q1 jump for Inspirational was nearly seven points and the shift away from Witty and Quirky cleverness is consistent.
- Alternative TLDs will keep taking share from .com. Even adjusting for tracking expansion, the Q1 .com share is too low to revert to Q4 levels in a single quarter. Expect .shop, .site, and .store to consolidate their early 2026 leadership through Q2.
- Solutions and Apex will hold their new top five business name word spots. Both reflect the broader shift away from Q4's creator economy categories toward service and B2B language, and that shift is unlikely to reverse in a single quarter.
Methodology
The Q1 2026 sample for this report includes 163,414 logos created, 944,189 business stage selections, 562,742 palette selections, 1,457,098 product interest selections, 412,801 custom icons generated, 75,191 slogan generations, and 98,110 font changes in the editor between January 1 and March 31, 2026, drawn globally. Comparisons reference 200,242 logos and the matching event counts for Q4 2025 (October 1 to December 31, 2025). All counts come from LOGO.com product analytics. These custom icons come from the LOGO.com AI logo generator.
Most figures are reported as percentages of their category so comparisons between quarters stay fair. Where Q4 2025 data is not directly comparable to Q1 2026, we flag it in the relevant section and compare patterns rather than raw shares.
This is a measure of where new brand activity is concentrating on our platform, not a measure of which industries grew fastest in the wider economy.
Cite This Report
Quarterly Business Trends Report, Q1 2026. First party data drawn from 163,414 logos created on LOGO.com between January 1 and March 31, 2026, benchmarked against 200,242 logos created in Q4 2025. Source: LOGO.com. Citation: "LOGO.com Quarterly Business Trends Report, Q1 2026, logo.com/blog/quarterly-business-trends-jan-march-2026."
Recent posts
Oct 19, 2026 by: Sean Baker
Oct 14, 2026 by: Vanessa Lam
Oct 12, 2026 by: Sean Baker
Oct 5, 2026 by: Sean Baker